
Page 342 - Solutions Manual to accompany Electric Machinery Fundamentals
P. 342
volts = 0;
end
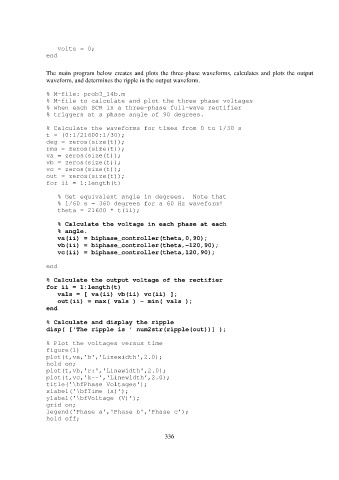
The main program below creates and plots the three-phase waveforms, calculates and plots the output
waveform, and determines the ripple in the output waveform.
% M-file: prob3_14b.m
% M-file to calculate and plot the three phase voltages
% when each SCR in a three-phase full-wave rectifier
% triggers at a phase angle of 90 degrees.
% Calculate the waveforms for times from 0 to 1/30 s
t = (0:1/21600:1/30);
deg = zeros(size(t));
rms = zeros(size(t));
va = zeros(size(t));
vb = zeros(size(t));
vc = zeros(size(t));
out = zeros(size(t));
for ii = 1:length(t)
% Get equivalent angle in degrees. Note that
% 1/60 s = 360 degrees for a 60 Hz waveform!
theta = 21600 * t(ii);
% Calculate the voltage in each phase at each
% angle.
va(ii) = biphase_controller(theta,0,90);
vb(ii) = biphase_controller(theta,-120,90);
vc(ii) = biphase_controller(theta,120,90);
end
% Calculate the output voltage of the rectifier
for ii = 1:length(t)
vals = [ va(ii) vb(ii) vc(ii) ];
out(ii) = max( vals ) - min( vals );
end
% Calculate and display the ripple
disp( ['The ripple is ' num2str(ripple(out))] );
% Plot the voltages versus time
figure(1)
plot(t,va,'b','Linewidth',2.0);
hold on;
plot(t,vb,'r:','Linewidth',2.0);
plot(t,vc,'k--','Linewidth',2.0);
title('\bfPhase Voltages');
xlabel('\bfTime (s)');
ylabel('\bfVoltage (V)');
grid on;
legend('Phase a','Phase b','Phase c');
hold off;
336