
Page 343 - Solutions Manual to accompany Electric Machinery Fundamentals
P. 343
% Plot the output voltages versus time
figure(2)
plot(t,out,'b','Linewidth',2.0);
title('\bfOutput Voltage');
xlabel('\bfTime (s)');
ylabel('\bfVoltage (V)');
axis( [0 1/30 0 260]);
grid on;
hold off;
When this program is executed, the results are:
» prob_3_14b
The ripple is 30.9547
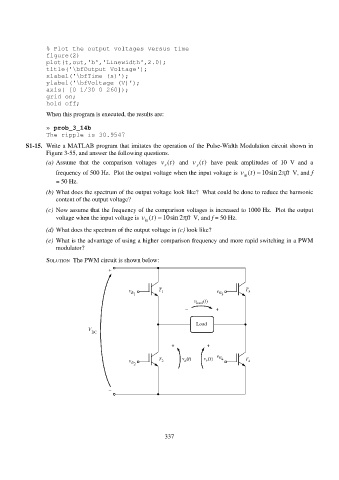
S1-15. Write a MATLAB program that imitates the operation of the Pulse-Width Modulation circuit shown in
Figure 3-55, and answer the following questions.
(a) Assume that the comparison voltages vt() and vt() have peak amplitudes of 10 V and a
x
y
frequency of 500 Hz. Plot the output voltage when the input voltage is vt() 10 sin 2 ft V, and f
in
= 50 Hz.
(b) What does the spectrum of the output voltage look like? What could be done to reduce the harmonic
content of the output voltage?
(c) Now assume that the frequency of the comparison voltages is increased to 1000 Hz. Plot the output
voltage when the input voltage is vt() 10 sin 2 ft V, and f = 50 Hz.
in
(d) What does the spectrum of the output voltage in (c) look like?
(e) What is the advantage of using a higher comparison frequency and more rapid switching in a PWM
modulator?
SOLUTION The PWM circuit is shown below:
337