
Page 192 - Materials Chemistry, Second Edition
P. 192
L1644_C04.fm Page 164 Tuesday, October 21, 2003 3:13 PM
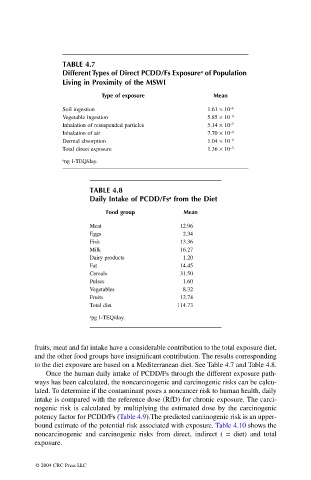
TABLE 4.7
a
Different Types of Direct PCDD/Fs Exposure of Population
Living in Proximity of the MSWI
Type of exposure Mean
Soil ingestion 1.61 × 10 –6
Vegetable ingestion 5.85 × 10 –4
Inhalation of resuspended particles 5.14 × 10 –7
Inhalation of air 7.70 × 10 –4
Dermal absorption 1.04 × 10 –9
Total direct exposure 1.36 × 10 –3
a ng I-TEQ/day.
TABLE 4.8
a
Daily Intake of PCDD/Fs from the Diet
Food group Mean
Meat 12.96
Eggs 2.34
Fish 13.36
Milk 16.27
Dairy products 1.20
Fat 14.45
Cereals 31.50
Pulses 1.60
Vegetables 8.32
Fruits 12.74
Total diet 114.73
a pg I-TEQ/day.
fruits, meat and fat intake have a considerable contribution to the total exposure diet,
and the other food groups have insignificant contribution. The results corresponding
to the diet exposure are based on a Mediterranean diet. See Table 4.7 and Table 4.8.
Once the human daily intake of PCDD/Fs through the different exposure path-
ways has been calculated, the noncarcinogenic and carcinogenic risks can be calcu-
lated. To determine if the contaminant poses a noncancer risk to human health, daily
intake is compared with the reference dose (RfD) for chronic exposure. The carci-
nogenic risk is calculated by multiplying the estimated dose by the carcinogenic
potency factor for PCDD/Fs (Table 4.9).The predicted carcinogenic risk is an upper-
bound estimate of the potential risk associated with exposure. Table 4.10 shows the
noncarcinogenic and carcinogenic risks from direct, indirect ( = diet) and total
exposure.
© 2004 CRC Press LLC