Page 357 - Integrated Wireless Propagation Models
P. 357

I n - B u i l d i n g   ( P i c o c e l l )   P r e d i c t i o n   M  o d e l s    335


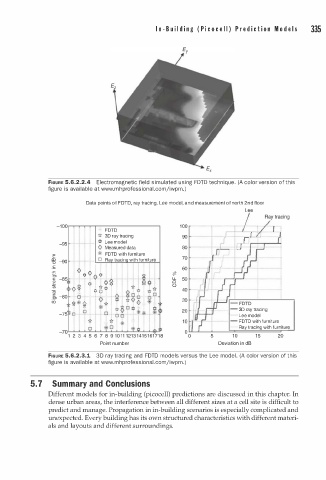
               FIGURE 5.6.2.2.4  Electromagnetic field simulated using FDTD technique. (A color version of this
                       a
               figure is av i l able at www.m h p rofessional.comjiwpm.)
                          Data points of FDTD, ray tracing, Lee model, and measurement of north 2nd floor
                                                                        Lee
                 -1 00 rT-r-----------------,        1 0 0             I )',"'""'
                                FDTO                                        .
                             "1":  30 ray tracing     90          J       1
                  -95         0  Lee model                            _/_
                             0  Measured data         80
                E            *  FDTO  with furniture   70
                �  -90       0  Rav tracina with furniture
                .!:                                   60
                £                                  ;R
                         0
                Ol     0  0  0 0                   0
                c  -851--                          lL   50
                Q)               (')               0
                           0   0 0                 ()
                �     0 �    0 g o                    40
                §,  -80   0
                Ui                                    30
                      � * �
                         0                                          -- 30 ray tracing
                  -75  0                                              Lee model
                           *                                        -- FDTO with furniture
                                                                      Ray tracing with furniture
                                                              5     1 0    1 5    20
                              Point number                      Deviation  n   dB
                                                                       i
                                     i
               FIGURE 5.6.2.3.1  3D ray trac n g and FDTD models versus the Lee model. (A color version of this
               figure is available at www.mhprofessional.comjiwpm.)
          5. 7   Summary and Conclusions
               Different models for in-building (picocell) predictions are discussed in this chapter. In
               dense urban areas, the interference between all different sizes at a cell site is difficult to
               predict and manage. Propagation in in-building scenarios is especially complicated and
               unexpected. Every building has its own structured characteristics with different materi­
               als and layouts and different surroundings.
   352   353   354   355   356   357   358   359   360   361   362