
Page 89 - Integrated Wireless Propagation Models
P. 89
M a c r o c e l l P r e d i c t i o n M o d e l s - P a r t 1 : A r e a - t o - A r e a M o d e l s 67
110
900 MHz =
ur
50% of locations in ban
=
100 area =
1000
800
hm 1.5 m
600
400
90 , :=
300
200
150
100
a. 80
Q; �8
:s: 30
-"'
70 •
I
h b
Q
(m)
60
�
::1.
50
�
[Q
� 40
.s::::
0,
c
� 30
Ui
"C 1000
Qi
u:: 20 800
600
450
10
300
200
0 150
100
70
-10 50
0.6 1 2 3 5 7 10 20 30 40 50 60 70 80 90 o30
1
o
�--Log. scale --+ Linear scale ------1
Distance (km)
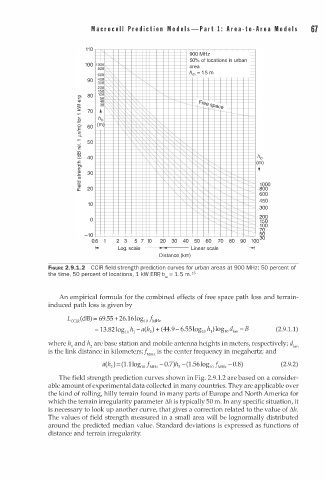
FIGURE 2.9.1.2 CCIR field strength prediction curves for r ban areas at 900 MHz: 50 percent of
u
the time, 50 percent of locations, 1 kW ERP, hm = 1. 5 m . 1 5
An empirical formula for the combined effects of free space path loss and terrain
induced path loss is given by
LcciR(dB) = 69.55 + 26.16log10 / MHz
- 13.82log10 � - a(h ) + (44.9- 6.55log10 h1) l og 0 dkm - B (2.9.1.1)
1
2
where h 1 and h are base station and mobile antenna heights in meters, respectively; dkm
2
is the link distance in kilometers;f z is the center frequency in megahertz; and
MH
(2.9.2)
The field strength prediction curves shown in Fig. 2.9.1.2 are based on a consider
able amount of experimental data collected in many countries. They are applicable over
the kind of rolling, hilly terrain found in many parts of Europe and North America for
which the terrain irregularity parameter t;.h is typically 50 m. In any specific situation, it
is necessary to look up another curve, that gives a correction related to the value of !1.h.
The values of field strength measured in a small area will be lognormally distributed
around the predicted median value. Standard deviations is expressed as functions of
distance and terrain irregularity.