
Page 93 - Integrated Wireless Propagation Models
P. 93
M a c r o c e l l P r e d i c t i o n M o d e l s - P a r t 1 : A r e a - t o - A r e a M o d e l s TI
N
•
20
1 8 1 9
1 6 1 7
1 5
/ Regents park 8 1 1
Route C 1 4 ,----- --+ - � -�-�--+- _--,--_ ---,
7 1 2 1 3
1 3
� 6 1 4
1 1 1 2 Transmitter
1 0 9
Route B
8
20 1 8
1 9
Hyde park
1 7 1 8
1 6 1 5
1 4
1 3
---• River thames
1 2
1 0 1 1
9 8 7
6
1
i
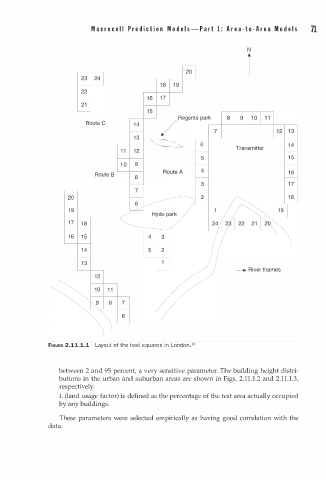
FIGURE 2.11.1.1 Layout of the test squares n London. 8
between 2 and 95 percent, a very sensitive parameter. The building height distri
1
butions in the urban and suburban areas are shown in Figs. 2.1 . 1 . 2 and 2.11.1.3,
respectively.
L (land usage factor) is defined as the percentage of the test area actually occupied
by any buildings.
These parameters were selected empirically as having good correlation with the
data.