
Page 97 - Integrated Wireless Propagation Models
P. 97
M a c r o c e l l P r e d i c t i o n M o d e l s - P a r t 1 : A r e a - t o - A r e a M o d e l s 75
Plane earth
1 5 0
1 4 0
ca 1 3 0
"0
"'
..Sl 1 2 0
.<::::
'iii
o_ 1 1 0
c
ctl
i5
� 1 0 0
90
80
2 3 4 5 6 7 8 9 1 0
Range, km
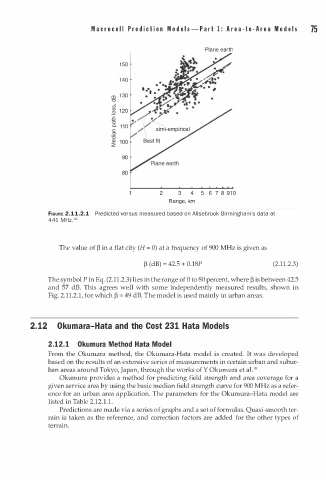
FIGURE 2.11.2.1 Predicted versus measured based on Allsebrook Birmingham's data at
1
441 H z. 8
M
The value of � in a flat city (H = 0) at a frequency of 900 MHz is given as
� (dB) = 42.5 + 0.18P (2.11.2.3)
P
The symbol i n Eq. (2.11.2.3) lies in the range of 0 to 80 percent, where � is between 42.5
and 57 dB. This agrees well with some independently measured results, shown in
Fig. 2.11.2.1, for which � = 49 dB. The model is used mainly in urban areas.
u
2.12 Ok m a r a-Hata and the Cost 231 Hata Models
2 . 1 2 . 1 Okumura Method Hata Model
From the Okumara method, the Okumara-Hata model is created. It was developed
based on the results of an extensive series of measurements in certain urban and subur
1
ban areas around Tokyo, Japan, through the works of Y Okumura et al. 9
Okumura provides a method for predicting field strength and area coverage for a
given service area by using the basic median field strength curve for 900 MHz as a refer
ence for an urban area application. The parameters for the Okumura-Hata model are
listed in Table 2.12 1 . 1 .
.
o
o
Predictions are made via a series f graphs and a set f formulas. Quasi-smooth ter
rain is taken as the reference, and correction factors are added for the other types of
terrain.