
Page 95 - Integrated Wireless Propagation Models
P. 95
M a c r o c e l l P r e d i c t i o n M o d e l s - P a r t 1 : A r e a - t o - A r e a M o d e l s 73
Frequency RMS Prediction
(MHz) Median Path Loss (dB) Error
168 Best fit 1.6 + 36.2 log d 5.3
fourth-power law - 12.5 + 40 log d 5.3
455 Best fit 15.0 + 43 1 1og d 6.18
.
fourth-power law - 4.0 + 40 log d 6.25
TABLE 2.11.1.1 Range Dependence Regression Equations at 168 and 455 M H z
1 5 0
1 4 0
p 4 5
((} 1 3 0 L
" P 1
L 6
1
g 2 0
0
� 1 1 0
;f 1 0 0
90
so ��--��----�----�----�--�
5 1 0 1 5 20 24
Test square number
n
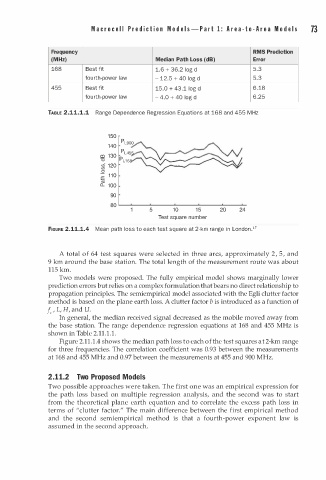
FIGURE 2.11.1.4 Mean path loss to each test square at 2-km range n Londo Y
i
o
A total f 64 test squares were selected in three arcs, approximately , 5 , and
2
9 km around the base station. The total length of the measurement route was about
115 km.
Two models were proposed. The fully empirical model shows marginally lower
prediction errors but relies on a complex formulation that bears no direct relationship to
propagation principles. The semiempirical model associated with the Egli clutter factor
method is based on the plane earth loss. A clutter factor b is introduced as a function of
fc , L, H, and U.
In general, the median received signal decreased as the mobile moved away from
the base station. The range dependence regression equations at 168 and 455 MHz is
1
shown in Table 2.1 . 1 . 1 .
t
o
a
Figure 2.11. 1 . 4 shows the median path loss o each f the test squares t 2-km range
for three frequencies. The correlation coefficient was 0.93 between the measurements
at 168 and 455 MHz and 0.97 between the measurements at 455 and 900 MHz.
2 . 1 1.2 Two Proposed Models
Two possible approaches were taken. The first one was an empirical expression for
the path loss based on multiple regression analysis, and the second was to start
from the theoretical plane earth equation and to correlate the excess path loss in
terms of "clutter factor." The main difference between the first empirical method
and the second semiempirical method is that a fourth-power exponent law is
assumed in the second approach.