
Page 312 - Intelligent Digital Oil And Gas Fields
P. 312
260 Intelligent Digital Oil and Gas Fields
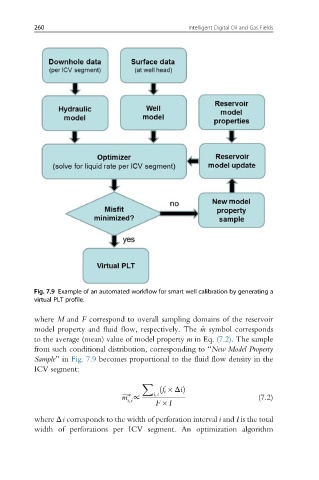
Fig. 7.9 Example of an automated workflow for smart well calibration by generating a
virtual PLT profile.
where M and F correspond to overall sampling domains of the reservoir
model property and fluid flow, respectively. The ^m symbol corresponds
to the average (mean) value of model property m in Eq. (7.2). The sample
from such conditional distribution, corresponding to “New Model Property
Sample”in Fig. 7.9 becomes proportional to the fluid flow density in the
ICV segment:
X
ð f i ΔiÞ
w
e m ∝ i,s (7.2)
s,i
F I
where Δi corresponds to the width of perforation interval i and I is the total
width of perforations per ICV segment. An optimization algorithm