
Page 309 - Intelligent Digital Oil And Gas Fields
P. 309
Smart Wells and Techniques for Reservoir Monitoring 257
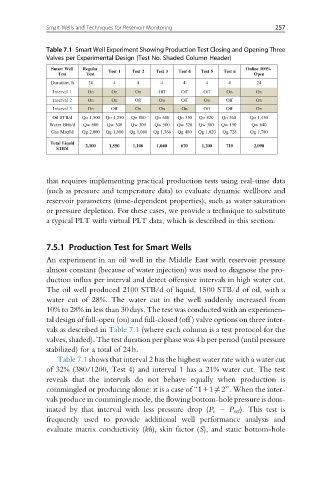
Table 7.1 Smart Well Experiment Showing Production Test Closing and Opening Three
Valves per Experimental Design (Test No. Shaded Column Header)
Smart Well Regular Test 1 Test 2 Test 3 Test 4 Test 5 Test 6 Online 100%
Test Test Open
Duration, h 24 4 4 4 4 4 4 24
Interval 1 On On On Off Off Off On On
Interval 2 On On Off On Off On Off On
Interval 3 On Off On On On Off Off On
Oil STB/d Qo 1,500 Qo 1,250 Qo 800 Qo 600 Qo 350 Qo 820 Qo 560 Qo 1,450
Water Bbls/d Qw 600 Qw 300 Qw 300 Qw 500 Qw 320 Qw 380 Qw 150 Qw 640
Gas Mscf/d Qg 2,000 Qg 1,680 Qg 1,066 Qg 1,366 Qg 480 Qg 1,020 Qg 728 Qg 1,780
Total Liquid 2,100 1,550 1,100 1,040 670 1,200 710 2,090
STB/d
that requires implementing practical production tests using real-time data
(such as pressure and temperature data) to evaluate dynamic wellbore and
reservoir parameters (time-dependent properties), such as water saturation
or pressure depletion. For these cases, we provide a technique to substitute
a typical PLT with virtual PLT data, which is described in this section.
7.5.1 Production Test for Smart Wells
An experiment in an oil well in the Middle East with reservoir pressure
almost constant (because of water injection) was used to diagnose the pro-
duction influx per interval and detect offensive intervals in high water cut.
The oil well produced 2100 STB/d of liquid, 1500 STB/d of oil, with a
water cut of 28%. The water cut in the well suddenly increased from
10% to 28% in less than 30days. The test was conducted with an experimen-
tal design of full-open (on) and full-closed (off ) valve options on three inter-
vals as described in Table 7.1 (where each column is a test protocol for the
valves, shaded). The test duration per phase was 4h per period (until pressure
stabilized) for a total of 24h.
Table 7.1 shows that interval 2 has the highest water rate with a water cut
of 32% (380/1200, Test 4) and interval 1 has a 21% water cut. The test
reveals that the intervals do not behave equally when production is
commingled or producing alone: it is a case of “1+16¼2”. When the inter-
vals produce in commingle mode, the flowing bottom-hole pressure is dom-
inated by that interval with less pressure drop (P r P wf ). This test is
frequently used to provide additional well performance analysis and
evaluate matrix conductivity (kh), skin factor (S), and static bottom-hole