
Page 36 - Intelligent Digital Oil And Gas Fields
P. 36
Introduction to Digital Oil and Gas Field Systems 17
• Predictive models for statistical analysis and intelligent components.
• Cognitive advising such as exception-based management, knowledge
capture, and continuous improvement.
1.5.4 User Interfaces and Visualization
Real-time operations centers (RTOC) have traditionally had large screens
with dashboards with various graphs, charts, tables, and gauges displayed
with real-time data on primarily desktop applications. The newest genera-
tion of DOF implementations have displays that go beyond traditional
dashboards, and include highly interactive dynamic and map-based, multi-
dimensional (color, size, type elements) displays on Web portals and mobile
infrastructure. The displays are fit-for-purpose, focused on individual roles
and comprehensive. The user interfaces (UI) display not only the basic data,
but also the diagnostics and analytics related to operational actions. The
visuals engage and stimulate engineers into collaborative processes. The
UIs are designed to guide engineers through a workflow, with automated
access and use for all the relevant data (Fig. 1.9). The DOF UIs should be
designed with the following features:
• efficient data reload, and data refresh,
• intuitive graphical design, self-explained, auto-flow, no manual
requested for simple task,
• GIS map-based feature set,
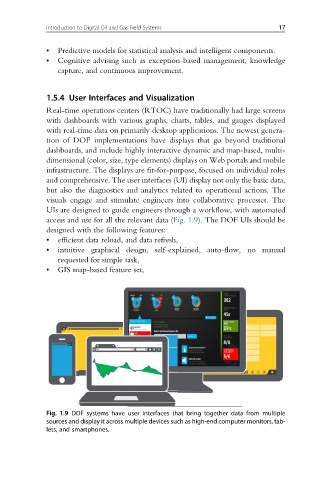
Fig. 1.9 DOF systems have user interfaces that bring together data from multiple
sources and display it across multiple devices such as high-end computer monitors, tab-
lets, and smartphones.