
Page 49 - Intelligent Digital Oil And Gas Fields
P. 49
Introduction to Digital Oil and Gas Field Systems 29
25,000 $100,000,000
Net profit Oil production w/o DOF (STB/d)
Oil production with DOF (STB/d) Cashflow (US$)
$80,000,000
20,000
$60,000,000
Oil production (STB/d) 15,000 NPV (mm) 177% IRR 22% $20,000,000
$40,000,000
$64
ROI ($/$)
4.2
Breakevent (y)
10,000
$−
$(20,000,000)
5000
$(40,000,000)
− $(60,000,000)
1 2 3 4 5 6 7 8 9 10 11 12 13 14 15 16 17 18 19 20
Time (months)
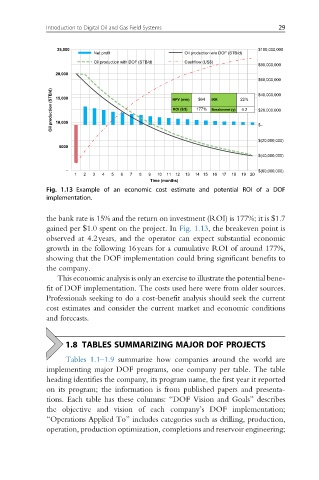
Fig. 1.13 Example of an economic cost estimate and potential ROI of a DOF
implementation.
the bank rate is 15% and the return on investment (ROI) is 177%; it is $1.7
gained per $1.0 spent on the project. In Fig. 1.13, the breakeven point is
observed at 4.2years, and the operator can expect substantial economic
growth in the following 16years for a cumulative ROI of around 177%,
showing that the DOF implementation could bring significant benefits to
the company.
This economic analysis is only an exercise to illustrate the potential bene-
fit of DOF implementation. The costs used here were from older sources.
Professionals seeking to do a cost-benefit analysis should seek the current
cost estimates and consider the current market and economic conditions
and forecasts.
1.8 TABLES SUMMARIZING MAJOR DOF PROJECTS
Tables 1.1–1.9 summarize how companies around the world are
implementing major DOF programs, one company per table. The table
heading identifies the company, its program name, the first year it reported
on its program; the information is from published papers and presenta-
tions. Each table has these columns: “DOF Vision and Goals” describes
the objective and vision of each company’s DOF implementation;
“Operations Applied To” includes categories such as drilling, production,
operation, production optimization, completions and reservoir engineering;