Page 113 - Intermediate Statistics for Dummies
P. 113

10_045206 ch05.qxd  2/1/07  9:49 AM  Page 92
                                92
                                         Part II: Making Predictions by Using Regression
                                         Pinpointing Possible Relationships
                                                    The third step in doing a multiple regression analysis (see the list in the
                                                    “Stepping through the analysis” section) is to find out which (if any) of your
                                                    possible x variables are actually related to y. If an x variable has no relationship
                                                    with y, including it in the model is pointless. Data analysts use a combination
                                                    of scatterplots and correlations to examine relationships between pairs of vari-
                                                    ables (as you can see in Chapter 4). While these two techniques can be viewed
                                                    under the heading of looking for relationships, I walk you through each one
                                                    separately in the following sections to discuss their nuances.
                                                    Making scatterplots
                                                    You make scatterplots in multiple linear regression to get a handle on whether
                                                    your possible x variables are even related to the y variable you’re studying. To
                                                    investigate these possible relationships, you make one scatterplot of each x
                                                    variable with the response variable y. If you have k different x variables being
                                                    considered for the final model, you make k different scatterplots.
                                                    To make a scatterplot in Minitab, enter your data in columns, where each
                                                    column represents a variable and each row represents all the data from one
                                                    individual. Go to Graph>Scatterplots>Simple. Select your y variable on the
                                                    left-hand side and click Select. That variable appears in the y-variable box on
                                                    the right-hand side. Then select your x variable on the left-hand side and
                                                    click Select. That variable appears in the x-variable box on the right-hand
                                                    side. Click OK.
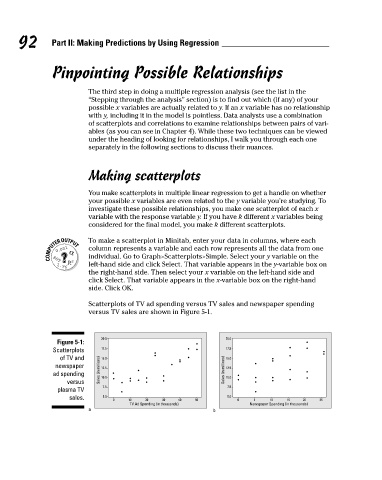
                                                    Scatterplots of TV ad spending versus TV sales and newspaper spending
                                                    versus TV sales are shown in Figure 5-1.
                                                       20.0                               20.0
                                           Figure 5-1:
                                          Scatterplots  17.5                              17.5
                                            of TV and  15.0                               15.0
                                          newspaper    12.5                               12.5
                                          ad spending  Sales (in millions)  10.0         Sales (in millions)  10.0
                                              versus
                                                        7.5                               7.5
                                           plasma TV
                                              sales.    5.0  0  10  20  30   40  50       5.0  0  5   10   15  20   25
                                                               TV Ad Spending (in thousands)    Newspaper Spending (in thousands)
                                                    a                                 b
   108   109   110   111   112   113   114   115   116   117   118