
Page 114 - Intermediate Statistics for Dummies
P. 114
10_045206 ch05.qxd 2/1/07 9:49 AM Page 93
Chapter 5: When Two Variables Are Better than One: Multiple Regression
You can see from Figure 5-1a that TV spending does appear to have a fairly
strong linear relationship with sales. This observation gives evidence that TV
ad spending may be useful in estimating plasma TV sales. Figure 5-1b shows a
linear relationship between newspaper ad spending and sales, but the rela-
tionship isn’t as strong as the one between TV ads and sales. However it may
be somewhat helpful in estimating sales.
Correlations: Examining the bond
The second portion of step three involves calculating and examining the cor-
relations between the x variables and the y variable. (Of course, if a scatter-
plot of an x variable and the y variable fails to come up with a pattern, then
you drop that x variable altogether and don’t proceed to find the correlation.)
Whenever you employ scatterplots to explore possible linear relationships,
correlations are typically not far behind. The correlation coefficient is a
number that measures the strength and direction of the linear relationship 93
between two variables, x and y. (See Chapter 4 for all the information you
need on correlation.) This process involves two parts:
Finding and interpreting the correlations
Testing the correlations to see which ones are statistically significant
(thereby determining which x variables are significantly related to y)
I explain these two steps in the following sections.
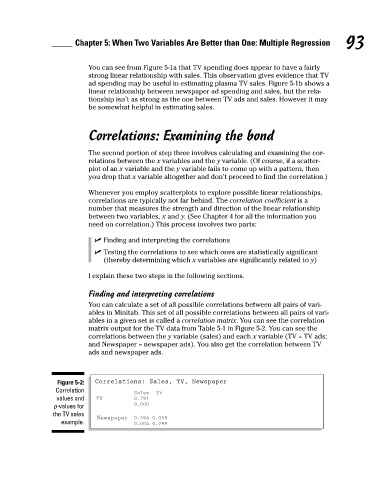
Finding and interpreting correlations
You can calculate a set of all possible correlations between all pairs of vari-
ables in Minitab. This set of all possible correlations between all pairs of vari-
ables in a given set is called a correlation matrix. You can see the correlation
matrix output for the TV data from Table 5-1 in Figure 5-2. You can see the
correlations between the y variable (sales) and each x variable (TV = TV ads;
and Newspaper = newspaper ads). You also get the correlation between TV
ads and newspaper ads.
Figure 5-2: Correlations: Sales, TV, Newspaper
Correlation Sales TV
values and TV 0.791
p-values for 0.000
the TV sales
Newspaper 0.594 0.058
example. 0.004 0.799