
Page 115 - Intermediate Statistics for Dummies
P. 115
10_045206 ch05.qxd 2/1/07 9:49 AM Page 94
94
Part II: Making Predictions by Using Regression
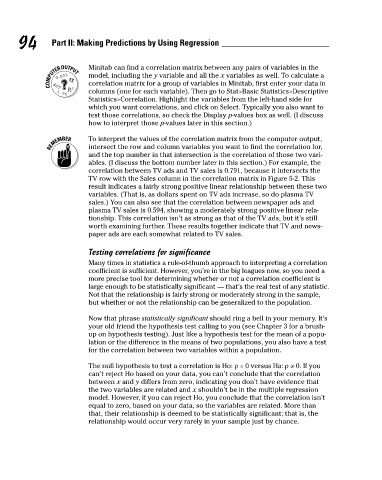
Minitab can find a correlation matrix between any pairs of variables in the
model, including the y variable and all the x variables as well. To calculate a
correlation matrix for a group of variables in Minitab, first enter your data in
columns (one for each variable). Then go to Stat>Basic Statistics>Descriptive
Statistics>Correlation. Highlight the variables from the left-hand side for
which you want correlations, and click on Select. Typically you also want to
test those correlations, so check the Display p-values box as well. (I discuss
how to interpret those p-values later in this section.)
To interpret the values of the correlation matrix from the computer output,
intersect the row and column variables you want to find the correlation for,
and the top number in that intersection is the correlation of those two vari-
ables. (I discuss the bottom number later in this section.) For example, the
correlation between TV ads and TV sales is 0.791, because it intersects the
TV row with the Sales column in the correlation matrix in Figure 5-2. This
result indicates a fairly strong positive linear relationship between these two
variables. (That is, as dollars spent on TV ads increase, so do plasma TV
sales.) You can also see that the correlation between newspaper ads and
plasma TV sales is 0.594, showing a moderately strong positive linear rela-
tionship. This correlation isn’t as strong as that of the TV ads, but it’s still
worth examining further. These results together indicate that TV and news-
paper ads are each somewhat related to TV sales.
Testing correlations for significance
Many times in statistics a rule-of-thumb approach to interpreting a correlation
coefficient is sufficient. However, you’re in the big leagues now, so you need a
more precise tool for determining whether or not a correlation coefficient is
large enough to be statistically significant — that’s the real test of any statistic.
Not that the relationship is fairly strong or moderately strong in the sample,
but whether or not the relationship can be generalized to the population.
Now that phrase statistically significant should ring a bell in your memory. It’s
your old friend the hypothesis test calling to you (see Chapter 3 for a brush-
up on hypothesis testing). Just like a hypothesis test for the mean of a popu-
lation or the difference in the means of two populations, you also have a test
for the correlation between two variables within a population.
The null hypothesis to test a correlation is Ho: ρ = 0 versus Ha: ρ≠ 0. If you
can’t reject Ho based on your data, you can’t conclude that the correlation
between x and y differs from zero, indicating you don’t have evidence that
the two variables are related and x shouldn’t be in the multiple regression
model. However, if you can reject Ho, you conclude that the correlation isn’t
equal to zero, based on your data, so the variables are related. More than
that, their relationship is deemed to be statistically significant; that is, the
relationship would occur very rarely in your sample just by chance.