
Page 119 - Intermediate Statistics for Dummies
P. 119
10_045206 ch05.qxd 2/1/07 9:49 AM Page 98
98
Part II: Making Predictions by Using Regression
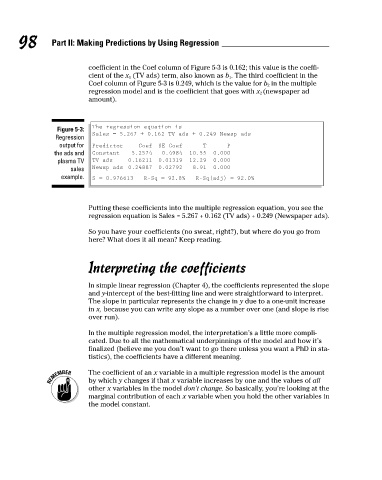
coefficient in the Coef column of Figure 5-3 is 0.162; this value is the coeffi-
cient of the x 1 (TV ads) term, also known as b 1 . The third coefficient in the
Coef column of Figure 5-3 is 0.249, which is the value for b 2 in the multiple
regression model and is the coefficient that goes with x 2 (newspaper ad
amount).
The regression equation is
Figure 5-3:
Sales = 5.267 + 0.162 TV ads + 0.249 Newsp ads
Regression
output for
Predictor
P
T
SE Coef
Coef
0.4984
10.55
Constant
5.2574
0.000
the ads and
12.29
0.000
TV ads
0.16211
0.01319
plasma TV
Newsp ads 0.24887
0.02792
8.91
0.000
sales
example.
S = 0.976613
R-Sq = 92.8%
R-Sq(adj) = 92.0%
Putting these coefficients into the multiple regression equation, you see the
regression equation is Sales = 5.267 + 0.162 (TV ads) + 0.249 (Newspaper ads).
So you have your coefficients (no sweat, right?), but where do you go from
here? What does it all mean? Keep reading.
Interpreting the coefficients
In simple linear regression (Chapter 4), the coefficients represented the slope
and y-intercept of the best-fitting line and were straightforward to interpret.
The slope in particular represents the change in y due to a one-unit increase
in x, because you can write any slope as a number over one (and slope is rise
over run).
In the multiple regression model, the interpretation’s a little more compli-
cated. Due to all the mathematical underpinnings of the model and how it’s
finalized (believe me you don’t want to go there unless you want a PhD in sta-
tistics), the coefficients have a different meaning.
The coefficient of an x variable in a multiple regression model is the amount
by which y changes if that x variable increases by one and the values of all
other x variables in the model don’t change. So basically, you’re looking at the
marginal contribution of each x variable when you hold the other variables in
the model constant.