
Page 124 - Intermediate Statistics for Dummies
P. 124
10_045206 ch05.qxd 2/1/07 9:50 AM Page 103
Chapter 5: When Two Variables Are Better than One: Multiple Regression
You can get the set of residual plots in two flavors:
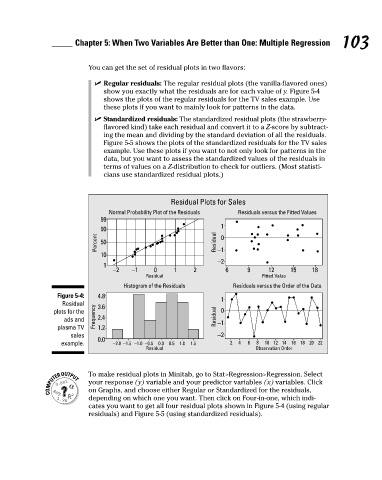
Regular residuals: The regular residual plots (the vanilla-flavored ones)
show you exactly what the residuals are for each value of y. Figure 5-4
shows the plots of the regular residuals for the TV sales example. Use
these plots if you want to mainly look for patterns in the data.
Standardized residuals: The standardized residual plots (the strawberry-
flavored kind) take each residual and convert it to a Z-score by subtract-
ing the mean and dividing by the standard deviation of all the residuals.
Figure 5-5 shows the plots of the standardized residuals for the TV sales
example. Use these plots if you want to not only look for patterns in the
data, but you want to assess the standardized values of the residuals in
terms of values on a Z-distribution to check for outliers. (Most statisti-
cians use standardized residual plots.)
Residual Plots for Sales 103
Normal Probability Plot of the Residuals Residuals versus the Fitted Values
99
1
90
Percent 50 Residual 0
10 −1
−2
1
−2 −1 0 1 2 6 9 12 15 18
Residual Fitted Value
Histogram of the Residuals Residuals versus the Order of the Data
Figure 5-4: 4.8
Residual 3.6 1
plots for the 0
ads and Frequency 2.4 Residual −1
plasma TV 1.2
sales −2
0.0
example. −2.0 −1.5 −1.0 −0.5 0.0 0.5 1.0 1.5 2 4 6 8 10 12 14 16 18 20 22
Residual Observation Order
To make residual plots in Minitab, go to Stat>Regression>Regression. Select
your response (y) variable and your predictor variables (x) variables. Click
on Graphs, and choose either Regular or Standardized for the residuals,
depending on which one you want. Then click on Four-in-one, which indi-
cates you want to get all four residual plots shown in Figure 5-4 (using regular
residuals) and Figure 5-5 (using standardized residuals).