Page 125 - Intermediate Statistics for Dummies
P. 125

10_045206 ch05.qxd  2/1/07  9:50 AM  Page 104
                               104
                                         Part II: Making Predictions by Using Regression
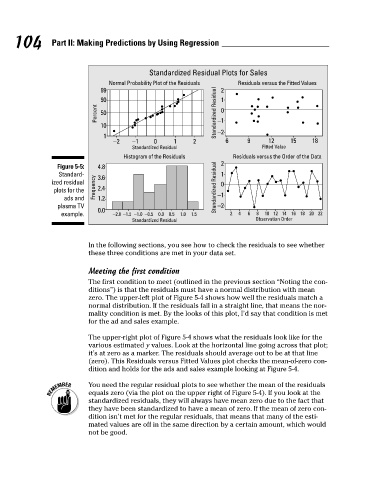
                                                                    Standardized Residual Plots for Sales
                                                                                             Residuals versus the Fitted Values
                                                       99
                                                       90
                                                       50
                                                       10
                                                                                       −2
                                                                                                                  18
                                                                                                9
                                                                                                      12
                                                                                                            15
                                                                      0
                                                                −1
                                                          −2
                                                                                 2
                                                                           1
                                                                                                    Fitted Value
                                                                Standardized Residual
                                                             Histogram of the Residuals
                                           Figure 5-5:
                                           Standard-
                                                      3.6
                                         ized residual
                                                      2.4
                                          plots for the
                                                                                       −1
                                             ads and
                                                      1.2
                                                                                       −2
                                           plasma TV  Frequency  Percent  4.8 1  Normal Probability Plot of the Residuals   Standardized Residual Standardized Residual  −1 2 1 0 2 1 0  6  Residuals versus the Order of the Data
                                                      0.0
                                            example.      −2.0  −1.5 −1.0 −0.5  0.0 0.5  1.0  1.5  2  4  6  8  10 12 14 16 18 20 22
                                                                Standardized Residual             Observation Order
                                                    In the following sections, you see how to check the residuals to see whether
                                                    these three conditions are met in your data set.
                                                    Meeting the first condition
                                                    The first condition to meet (outlined in the previous section “Noting the con-
                                                    ditions”) is that the residuals must have a normal distribution with mean
                                                    zero. The upper-left plot of Figure 5-4 shows how well the residuals match a
                                                    normal distribution. If the residuals fall in a straight line, that means the nor-
                                                    mality condition is met. By the looks of this plot, I’d say that condition is met
                                                    for the ad and sales example.
                                                    The upper-right plot of Figure 5-4 shows what the residuals look like for the
                                                    various estimated y values. Look at the horizontal line going across that plot;
                                                    it’s at zero as a marker. The residuals should average out to be at that line
                                                    (zero). This Residuals versus Fitted Values plot checks the mean-of-zero con-
                                                    dition and holds for the ads and sales example looking at Figure 5-4.
                                                    You need the regular residual plots to see whether the mean of the residuals
                                                    equals zero (via the plot on the upper right of Figure 5-4). If you look at the
                                                    standardized residuals, they will always have mean zero due to the fact that
                                                    they have been standardized to have a mean of zero. If the mean of zero con-
                                                    dition isn’t met for the regular residuals, that means that many of the esti-
                                                    mated values are off in the same direction by a certain amount, which would
                                                    not be good.
   120   121   122   123   124   125   126   127   128   129   130