
Page 130 - Intermediate Statistics for Dummies
P. 130
11_045206 ch06.qxd 2/1/07 9:52 AM Page 109
Chapter 6: One Step Forward and Two Steps Back: Regression Model Selection
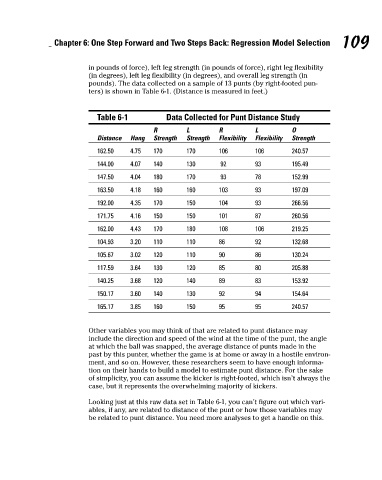
in pounds of force), left leg strength (in pounds of force), right leg flexibility
(in degrees), left leg flexibility (in degrees), and overall leg strength (in
pounds). The data collected on a sample of 13 punts (by right-footed pun-
ters) is shown in Table 6-1. (Distance is measured in feet.)
Table 6-1
L
O
L
R
Flexibility
Distance
Flexibility
Strength
Strength
Strength
4.75
170
240.57
106
170
106
162.50
140
4.07
130
195.49
93
144.00
92
180
152.99
78
4.04
170
93
147.50
103
197.09
93
160
4.18
163.50
160
192.00 Hang R Data Collected for Punt Distance Study 109
104
93
266.56
150
170
4.35
171.75 4.16 150 150 101 87 260.56
162.00 4.43 170 180 108 106 219.25
104.93 3.20 110 110 86 92 132.68
105.67 3.02 120 110 90 86 130.24
117.59 3.64 130 120 85 80 205.88
140.25 3.68 120 140 89 83 153.92
150.17 3.60 140 130 92 94 154.64
165.17 3.85 160 150 95 95 240.57
Other variables you may think of that are related to punt distance may
include the direction and speed of the wind at the time of the punt, the angle
at which the ball was snapped, the average distance of punts made in the
past by this punter, whether the game is at home or away in a hostile environ-
ment, and so on. However, these researchers seem to have enough informa-
tion on their hands to build a model to estimate punt distance. For the sake
of simplicity, you can assume the kicker is right-footed, which isn’t always the
case, but it represents the overwhelming majority of kickers.
Looking just at this raw data set in Table 6-1, you can’t figure out which vari-
ables, if any, are related to distance of the punt or how those variables may
be related to punt distance. You need more analyses to get a handle on this.