
Page 133 - Intermediate Statistics for Dummies
P. 133
11_045206 ch06.qxd 2/1/07 9:52 AM Page 112
112
Part II: Making Predictions by Using Regression
To get a set of all the correlations between any set of variables in your model
by using Minitab, go to Stat>Basic Statistics>Correlation. Then highlight all the
variables you want correlations for and click Select. (To include the p-values
for each correlation, click the Display p-values box.) Then click OK. You can
see a listing of all the variables’ names across the top row and down the first
column. Intersect the row depicting the first variable with the column depicting
the second variable, and you can find the correlation for that pair.
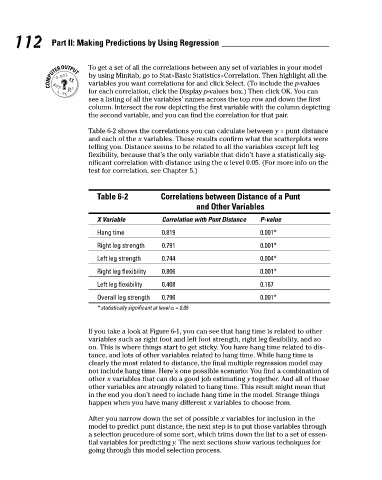
Table 6-2 shows the correlations you can calculate between y = punt distance
and each of the x variables. These results confirm what the scatterplots were
telling you. Distance seems to be related to all the variables except left leg
flexibility, because that’s the only variable that didn’t have a statistically sig-
nificant correlation with distance using the α level 0.05. (For more info on the
test for correlation, see Chapter 5.)
Correlations between Distance of a Punt
Table 6-2
and Other Variables
X Variable Correlation with Punt Distance P-value
Hang time 0.819 0.001*
Right leg strength 0.791 0.001*
Left leg strength 0.744 0.004*
Right leg flexibility 0.806 0.001*
Left leg flexibility 0.408 0.167
Overall leg strength 0.796 0.001*
* statistically significant at level α = 0.05
If you take a look at Figure 6-1, you can see that hang time is related to other
variables such as right foot and left foot strength, right leg flexibility, and so
on. This is where things start to get sticky. You have hang time related to dis-
tance, and lots of other variables related to hang time. While hang time is
clearly the most related to distance, the final multiple regression model may
not include hang time. Here’s one possible scenario: You find a combination of
other x variables that can do a good job estimating y together. And all of those
other variables are strongly related to hang time. This result might mean that
in the end you don’t need to include hang time in the model. Strange things
happen when you have many different x variables to choose from.
After you narrow down the set of possible x variables for inclusion in the
model to predict punt distance, the next step is to put those variables through
a selection procedure of some sort, which trims down the list to a set of essen-
tial variables for predicting y. The next sections show various techniques for
going through this model selection process.