
Page 188 - Intermediate Statistics for Dummies
P. 188
15_045206 ch09.qxd 2/1/07 10:12 AM Page 167
Chapter 9: Going One-Way with Analysis of Variance
42
39
36
45
51
48
Age Group 1
Age Group 2
15
10
5
Percent
0
Age Group 4
Age Group 3
20
15
10
0 5 Histogram of Age Group 1, Age Group 2, Age Group 3, Age Group 4 20 167
36 39 42 45 48 51
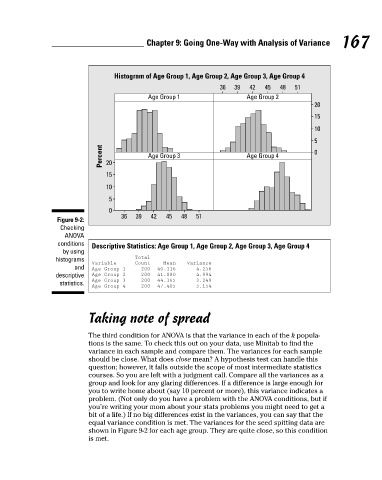
Figure 9-2:
Checking
ANOVA
conditions Descriptive Statistics: Age Group 1, Age Group 2, Age Group 3, Age Group 4
by using
histograms Total
Variable Count Mean Variance
and Age Group 1 200 40.116 4.256
descriptive Age Group 2 200 41.880 4.994
Age Group 3 200 44.165 3.249
statistics.
Age Group 4 200 47.405 5.154
Taking note of spread
The third condition for ANOVA is that the variance in each of the k popula-
tions is the same. To check this out on your data, use Minitab to find the
variance in each sample and compare them. The variances for each sample
should be close. What does close mean? A hypothesis test can handle this
question; however, it falls outside the scope of most intermediate statistics
courses. So you are left with a judgment call. Compare all the variances as a
group and look for any glaring differences. If a difference is large enough for
you to write home about (say 10 percent or more), this variance indicates a
problem. (Not only do you have a problem with the ANOVA conditions, but if
you’re writing your mom about your stats problems you might need to get a
bit of a life.) If no big differences exist in the variances, you can say that the
equal variance condition is met. The variances for the seed spitting data are
shown in Figure 9-2 for each age group. They are quite close, so this condition
is met.