Page 34 - Intermediate Statistics for Dummies
P. 34

05_045206 ch01.qxd  2/1/07  9:41 AM  Page 13
                                             Chapter 1: Beyond Number Crunching: The Art and Science of Data Analysis
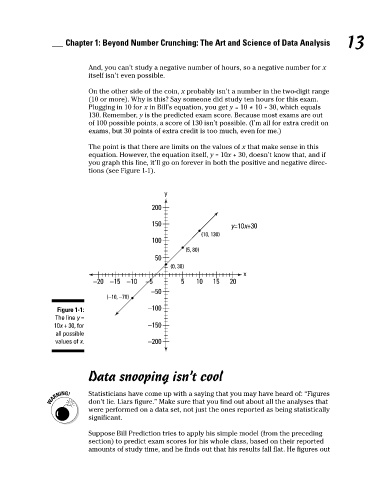
                                                    And, you can’t study a negative number of hours, so a negative number for x
                                                    itself isn’t even possible.
                                                    On the other side of the coin, x probably isn’t a number in the two-digit range
                                                    (10 or more). Why is this? Say someone did study ten hours for this exam.
                                                    Plugging in 10 for x in Bill’s equation, you get y = 10  10 + 30, which equals
                                                    130. Remember, y is the predicted exam score. Because most exams are out
                                                    of 100 possible points, a score of 130 isn’t possible. (I’m all for extra credit on
                                                    exams, but 30 points of extra credit is too much, even for me.)
                                                    The point is that there are limits on the values of x that make sense in this
                                                    equation. However, the equation itself, y = 10x + 30, doesn’t know that, and if
                                                    you graph this line, it’ll go on forever in both the positive and negative direc-
                                                    tions (see Figure 1-1).
                                                                     200  y                     *                          13
                                                                     150                   y=10x+30
                                                                     100
                                                                      50
                                                                                               x
                                                     −20  −15  −10  −5       5    10  15   20
                                                                     −50
                                           Figure 1-1:              −100
                                          The line y =
                                          10x + 30, for             −150
                                          all possible
                                          values of x.              −200

                                                    Data snooping isn’t cool


                                                    Statisticians have come up with a saying that you may have heard of: “Figures
                                                    don’t lie. Liars figure.” Make sure that you find out about all the analyses that
                                                    were performed on a data set, not just the ones reported as being statistically
                                                    significant.

                                                    Suppose Bill Prediction tries to apply his simple model (from the preceding
                                                    section) to predict exam scores for his whole class, based on their reported
                                                    amounts of study time, and he finds out that his results fall flat. He figures out
   29   30   31   32   33   34   35   36   37   38   39