
Page 37 - Intermediate Statistics for Dummies
P. 37
05_045206 ch01.qxd 2/1/07 9:41 AM Page 16
16
Part I: Data Analysis and Model-Building Basics
Table 1-1 (continued)
Days Lasted: Sugar Water
Days Lasted: Water Only
Observation
8
3
4
2
3
9
10
3
4
11
5
4
5
12
4
Setting the hypothesis
Ellen wants to compare the two methods, water and sugar, to see whether
the roses that had sugar added lasted longer than the regular water group.
She needs to conduct a hypothesis test whose null hypothesis is Ho: There is
no difference in days lasted for sugar group versus control group. Her alter-
native hypothesis, which she hopes to show, is Ha: The roses in the sugar
group lasted longer than the control group. She figures a two-sample t-test is
in order here. (I discuss hypothesis tests in Chapter 3.)
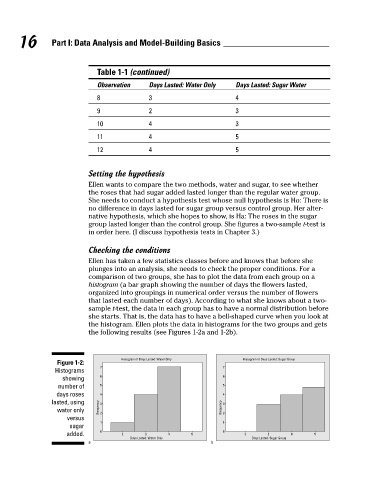
Checking the conditions
Ellen has taken a few statistics classes before and knows that before she
plunges into an analysis, she needs to check the proper conditions. For a
comparison of two groups, she has to plot the data from each group on a
histogram (a bar graph showing the number of days the flowers lasted,
organized into groupings in numerical order versus the number of flowers
that lasted each number of days). According to what she knows about a two-
sample t-test, the data in each group has to have a normal distribution before
she starts. That is, the data has to have a bell-shaped curve when you look at
the histogram. Ellen plots the data in histograms for the two groups and gets
the following results (see Figures 1-2a and 1-2b).
Histogram of Days Lasted: Water Only Histogram of Days Lasted: Sugar Group
Figure 1-2:
7 7
Histograms
showing 6 6
number of 5 5
days roses 4 4
lasted, using 3 3
water only Frequency 2 Frequency 2
versus
1 1
sugar
0 0
added. 2 3 4 5 2 3 4 5
Days Lasted: Water Only Days Lasted: Sugar Group
a b