
Page 56 - Intermediate Statistics for Dummies
P. 56
06_045206 ch02.qxd 2/1/07 9:42 AM Page 35
Chapter 2: Sorting through Statistical Techniques
columns to represent the two variables), and analyzing the data by using a
Chi-square test (see Chapter 14). By following this process, you can deter-
mine whether two categorical variables are independent (unrelated) or
whether a relationship exists between them. If you find a relationship, you
can use percentages to describe it.
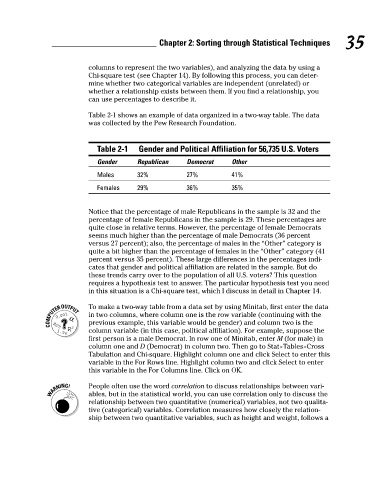
Table 2-1 shows an example of data organized in a two-way table. The data
was collected by the Pew Research Foundation.
Gender and Political Affiliation for 56,735 U.S. Voters
Table 2-1
Other
Republican
Gender
Democrat
Males
32%
27%
41%
35%
36%
29%
Females
Notice that the percentage of male Republicans in the sample is 32 and the 35
percentage of female Republicans in the sample is 29. These percentages are
quite close in relative terms. However, the percentage of female Democrats
seems much higher than the percentage of male Democrats (36 percent
versus 27 percent); also, the percentage of males in the “Other” category is
quite a bit higher than the percentage of females in the “Other” category (41
percent versus 35 percent). These large differences in the percentages indi-
cates that gender and political affiliation are related in the sample. But do
these trends carry over to the population of all U.S. voters? This question
requires a hypothesis test to answer. The particular hypothesis test you need
in this situation is a Chi-square test, which I discuss in detail in Chapter 14.
To make a two-way table from a data set by using Minitab, first enter the data
in two columns, where column one is the row variable (continuing with the
previous example, this variable would be gender) and column two is the
column variable (in this case, political affiliation). For example, suppose the
first person is a male Democrat. In row one of Minitab, enter M (for male) in
column one and D (Democrat) in column two. Then go to Stat>Tables>Cross
Tabulation and Chi-square. Highlight column one and click Select to enter this
variable in the For Rows line. Highlight column two and click Select to enter
this variable in the For Columns line. Click on OK.
People often use the word correlation to discuss relationships between vari-
ables, but in the statistical world, you can use correlation only to discuss the
relationship between two quantitative (numerical) variables, not two qualita-
tive (categorical) variables. Correlation measures how closely the relation-
ship between two quantitative variables, such as height and weight, follows a