Page 59 - Intermediate Statistics for Dummies
P. 59

06_045206 ch02.qxd  2/1/07  9:42 AM  Page 38
                                38
                                         Part I: Data Analysis and Model-Building Basics
                                                    females. This assessment requires a hypothesis test of two means (often-
                                                    times called a t-test for independent samples). I present more information
                                                    on this technique in Chapter 3.
                                                    When comparing the means of more than two groups, don’t simply look at all
                                                    the possible t-tests that you can do on the pairs of means, because you have
                                                    to control for an overall error rate in your analysis. Too many analyses can
                                                    result in errors — adding up to disaster. For example, if you conduct 100
                                                    hypothesis tests, each one with a 5 percent error rate, then 5 of those 100
                                                    tests give wrong results on average, just by chance.
                                                    If you want to compare the average wage in different regions of the country
                                                    (the East, the Midwest, the South, and the West, for example), this compari-
                                                    son requires a more sophisticated analysis, because you’re looking at four
                                                    groups rather than just two. The procedure you can use to compare more
                                                    than two means is called analysis of variance (ANOVA), and I discuss this
                                                    method in detail in Chapters 9 and 10.
                                                    Finding connections
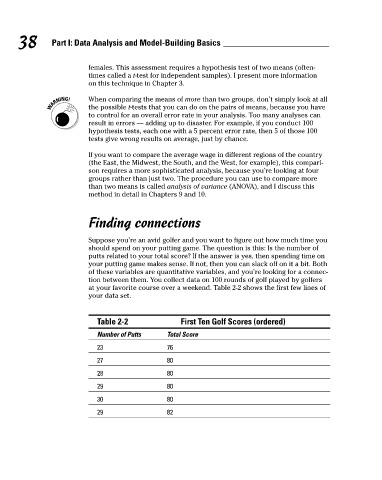
                                                    Suppose you’re an avid golfer and you want to figure out how much time you
                                                    should spend on your putting game. The question is this: Is the number of
                                                    putts related to your total score? If the answer is yes, then spending time on
                                                    your putting game makes sense. If not, then you can slack off on it a bit. Both
                                                    of these variables are quantitative variables, and you’re looking for a connec-
                                                    tion between them. You collect data on 100 rounds of golf played by golfers
                                                    at your favorite course over a weekend. Table 2-2 shows the first few lines of
                                                    your data set.
                                                      Table 2-2              First Ten Golf Scores (ordered)
                                                      Number of Putts    Total Score
                                                      23                 76
                                                      27                 80
                                                      28                 80
                                                      29                 80
                                                      30                 80
                                                      29                 82
   54   55   56   57   58   59   60   61   62   63   64