
Page 126 - Intro Predictive Maintenance
P. 126
Vibration Monitoring and Analysis 117
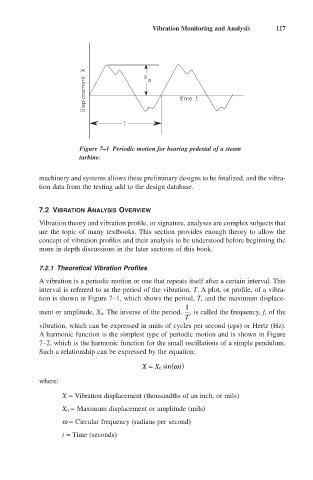
Figure 7–1 Periodic motion for bearing pedestal of a steam
turbine.
machinery and systems allows these preliminary designs to be finalized, and the vibra-
tion data from the testing add to the design database.
7.2 VIBRATION ANALYSIS OVERVIEW
Vibration theory and vibration profile, or signature, analyses are complex subjects that
are the topic of many textbooks. This section provides enough theory to allow the
concept of vibration profiles and their analysis to be understood before beginning the
more in-depth discussions in the later sections of this book.
7.2.1 Theoretical Vibration Profiles
A vibration is a periodic motion or one that repeats itself after a certain interval. This
interval is referred to as the period of the vibration, T. A plot, or profile, of a vibra-
tion is shown in Figure 7–1, which shows the period, T, and the maximum displace-
1
ment or amplitude, X 0. The inverse of the period, , is called the frequency, f, of the
T
vibration, which can be expressed in units of cycles per second (cps) or Hertz (Hz).
A harmonic function is the simplest type of periodic motion and is shown in Figure
7–2, which is the harmonic function for the small oscillations of a simple pendulum.
Such a relationship can be expressed by the equation:
X = X 0 sin (w t)
where:
X = Vibration displacement (thousandths of an inch, or mils)
X 0 = Maximum displacement or amplitude (mils)
w = Circular frequency (radians per second)
t = Time (seconds)