
Page 127 - Intro Predictive Maintenance
P. 127
118 An Introduction to Predictive Maintenance
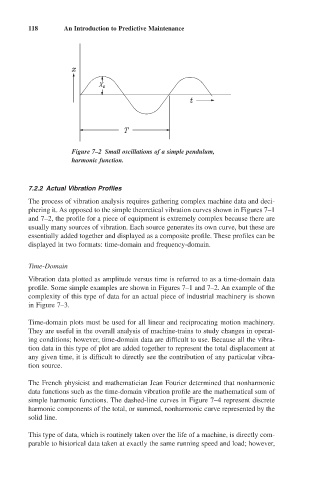
Figure 7–2 Small oscillations of a simple pendulum,
harmonic function.
7.2.2 Actual Vibration Profiles
The process of vibration analysis requires gathering complex machine data and deci-
phering it. As opposed to the simple theoretical vibration curves shown in Figures 7–1
and 7–2, the profile for a piece of equipment is extremely complex because there are
usually many sources of vibration. Each source generates its own curve, but these are
essentially added together and displayed as a composite profile. These profiles can be
displayed in two formats: time-domain and frequency-domain.
Time-Domain
Vibration data plotted as amplitude versus time is referred to as a time-domain data
profile. Some simple examples are shown in Figures 7–1 and 7–2. An example of the
complexity of this type of data for an actual piece of industrial machinery is shown
in Figure 7–3.
Time-domain plots must be used for all linear and reciprocating motion machinery.
They are useful in the overall analysis of machine-trains to study changes in operat-
ing conditions; however, time-domain data are difficult to use. Because all the vibra-
tion data in this type of plot are added together to represent the total displacement at
any given time, it is difficult to directly see the contribution of any particular vibra-
tion source.
The French physicist and mathematician Jean Fourier determined that nonharmonic
data functions such as the time-domain vibration profile are the mathematical sum of
simple harmonic functions. The dashed-line curves in Figure 7–4 represent discrete
harmonic components of the total, or summed, nonharmonic curve represented by the
solid line.
This type of data, which is routinely taken over the life of a machine, is directly com-
parable to historical data taken at exactly the same running speed and load; however,