
Page 129 - Intro Predictive Maintenance
P. 129
120 An Introduction to Predictive Maintenance
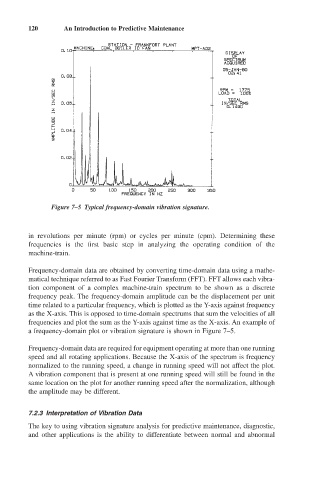
Figure 7–5 Typical frequency-domain vibration signature.
in revolutions per minute (rpm) or cycles per minute (cpm). Determining these
frequencies is the first basic step in analyzing the operating condition of the
machine-train.
Frequency-domain data are obtained by converting time-domain data using a mathe-
matical technique referred to as Fast Fourier Transform (FFT). FFT allows each vibra-
tion component of a complex machine-train spectrum to be shown as a discrete
frequency peak. The frequency-domain amplitude can be the displacement per unit
time related to a particular frequency, which is plotted as the Y-axis against frequency
as the X-axis. This is opposed to time-domain spectrums that sum the velocities of all
frequencies and plot the sum as the Y-axis against time as the X-axis. An example of
a frequency-domain plot or vibration signature is shown in Figure 7–5.
Frequency-domain data are required for equipment operating at more than one running
speed and all rotating applications. Because the X-axis of the spectrum is frequency
normalized to the running speed, a change in running speed will not affect the plot.
A vibration component that is present at one running speed will still be found in the
same location on the plot for another running speed after the normalization, although
the amplitude may be different.
7.2.3 Interpretation of Vibration Data
The key to using vibration signature analysis for predictive maintenance, diagnostic,
and other applications is the ability to differentiate between normal and abnormal