
Page 332 - Intro Predictive Maintenance
P. 332
Failure-Mode Analysis 323
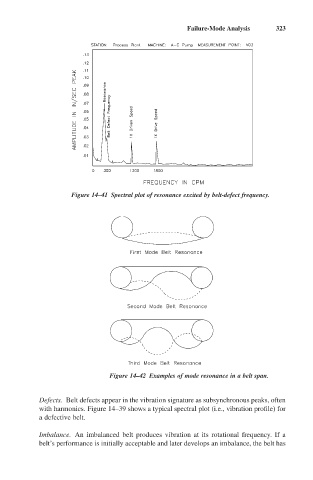
Figure 14–41 Spectral plot of resonance excited by belt-defect frequency.
Figure 14–42 Examples of mode resonance in a belt span.
Defects. Belt defects appear in the vibration signature as subsynchronous peaks, often
with harmonics. Figure 14–39 shows a typical spectral plot (i.e., vibration profile) for
a defective belt.
Imbalance. An imbalanced belt produces vibration at its rotational frequency. If a
belt’s performance is initially acceptable and later develops an imbalance, the belt has