
Page 414 - Intro Predictive Maintenance
P. 414
World-Class Maintenance 405
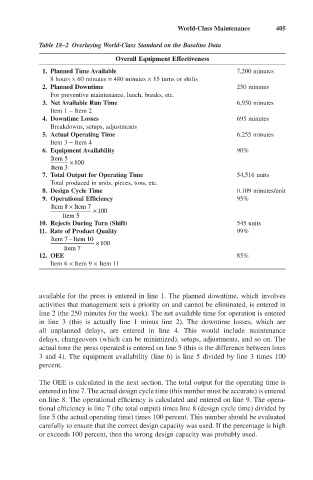
Table 18–2 Overlaying World-Class Standard on the Baseline Data
Overall Equipment Effectiveness
1. Planned Time Available 7,200 minutes
8 hours ¥ 60 minutes = 480 minutes ¥ 15 turns or shifts
2. Planned Downtime 250 minutes
For preventive maintenance, lunch, breaks, etc.
3. Net Available Run Time 6,950 minutes
Item 1 - Item 2
4. Downtime Losses 695 minutes
Breakdowns, setups, adjustments
5. Actual Operating Time 6,255 minutes
Item 3 - Item 4
6. Equipment Availability 90%
Item 5
¥100
Item 3
7. Total Output for Operating Time 54,516 units
Total produced in units, pieces, tons, etc.
8. Design Cycle Time 0.109 minutes/unit
9. Operational Efficiency 95%
Item 8 ¥ Item 7
¥100
Item 5
10. Rejects During Turn (Shift) 545 units
11. Rate of Product Quality 99%
Item 7 Item 10
-
¥100
Item 7
12. OEE 85%
Item 6 ¥ Item 9 ¥ Item 11
available for the press is entered in line 1. The planned downtime, which involves
activities that management sets a priority on and cannot be eliminated, is entered in
line 2 (the 250 minutes for the week). The net available time for operation is entered
in line 3 (this is actually line 1 minus line 2). The downtime losses, which are
all unplanned delays, are entered in line 4. This would include maintenance
delays, changeovers (which can be minimized), setups, adjustments, and so on. The
actual time the press operated is entered on line 5 (this is the difference between lines
3 and 4). The equipment availability (line 6) is line 5 divided by line 3 times 100
percent.
The OEE is calculated in the next section. The total output for the operating time is
entered in line 7. The actual design cycle time (this number must be accurate) is entered
on line 8. The operational efficiency is calculated and entered on line 9. The opera-
tional efficiency is line 7 (the total output) times line 8 (design cycle time) divided by
line 5 (the actual operating time) times 100 percent. This number should be evaluated
carefully to ensure that the correct design capacity was used. If the percentage is high
or exceeds 100 percent, then the wrong design capacity was probably used.