
Page 416 - Intro Predictive Maintenance
P. 416
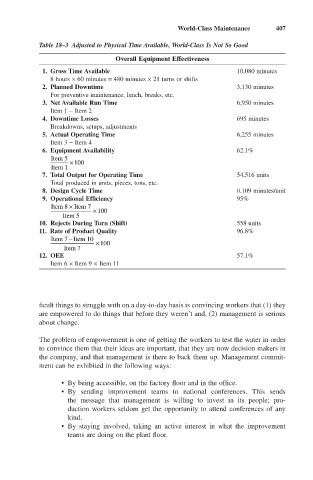
World-Class Maintenance     407

            Table 18–3 Adjusted to Physical Time Available, World-Class Is Not So Good

                                 Overall Equipment Effectiveness
             1. Gross Time Available                               10,080 minutes
               8 hours ¥ 60 minutes = 480 minutes ¥ 21 turns or shifts
             2. Planned Downtime                                   3,130 minutes
               For preventive maintenance, lunch, breaks, etc.
             3. Net Available Run Time                             6,950 minutes
               Item 1 - Item 2
             4. Downtime Losses                                    695 minutes
               Breakdowns, setups, adjustments
             5. Actual Operating Time                              6,255 minutes
               Item 3 - Item 4
             6. Equipment Availability                             62.1%
               Item 5
                    ¥100
               Item 1
             7. Total Output for Operating Time                    54,516 units
               Total produced in units, pieces, tons, etc.
             8. Design Cycle Time                                  0.109 minutes/unit
             9. Operational Efficiency                              95%
               Item 8 ¥  Item 7
                           ¥100
                  Item 5
            10. Rejects During Turn (Shift)                        558 units
            11. Rate of Product Quality                            96.8%
               Item 7 Item 10
                    -
                            ¥100
                   Item 7
            12. OEE                                                57.1%
               Item 6 ¥ Item 9 ¥ Item 11


            ficult things to struggle with on a day-to-day basis is convincing workers that (1) they
            are empowered to do things that before they weren’t and, (2) management is serious
            about change.

            The problem of empowerment is one of getting the workers to test the water in order
            to convince them that their ideas are important, that they are now decision makers in
            the company, and that management is there to back them up. Management commit-
            ment can be exhibited in the following ways:

                  • By being accessible, on the factory floor and in the office.
                  • By sending improvement teams to national conferences.  This sends
                    the message that management is willing to invest in its people; pro-
                    duction workers seldom get the opportunity to attend conferences of any
                    kind.
                  • By staying involved, taking an active interest in what the improvement
                    teams are doing on the plant floor.