
Page 157 - Intro to Space Sciences Spacecraft Applications
P. 157
144 Introduction to Space Sciences and Spacecraft Applications
RayZeigh scattering (pictured as a peanut-shaped pattern in the figure) is
very direction-dependent and the scattering angles (denoted by a+ and a-)
are a function of both the sun’s zenith angle and the satellite look angle. The
total amount of Rayleigh scattered energy received by the remote sensor
may come from different sources: that scattered from direct illumination by
the sun (Ih+), the reflection of this scattered energy off the surface of the
earth (I%-), and that portion of the sun’s energy that first reflects off the
surface of the earth and then gets Rayleigh scattered (1%).
Finally, the satellite sensor may receive energy directly from the earth’s
surface. The energy level of the radiation leaving the surface (whether the
earth’s natural temperature-related radiations or reflection of solar or
man-induced signals) is denoted by I,,.
Transmissivity. Since the energy received by a remote sensor must prop-
agate through the atmosphere, this energy may be changed during transit
due to the different scattering modes and the absorption and reradiation of
energy by the components of the atmosphere, all of which are highly fre-
quency-dependent. The effect of the atmosphere on electromagnetic prop-
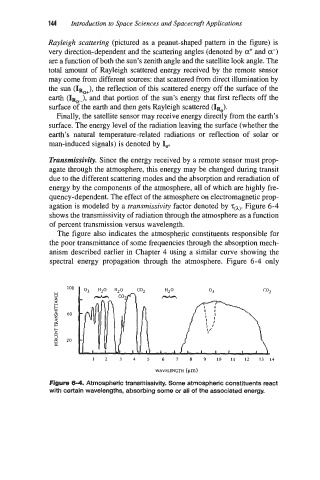
agation is modeled by a transmissivity factor denoted by ~(1). Figure 6-4
shows the transmissivity of radiation through the atmosphere as a function
of percent transmission versus wavelength.
The figure also indicates the atmospheric constituents responsible for
the poor transmittance of some frequencies through the absorption mech-
anism described earlier in Chapter 4 using a similar curve showing the
spectral energy propagation through the atmosphere. Figure 6-4 only
100
w
U
Q
!=
60
2
k
B
6 20
e
1 2 3 4 5 6 7 8 9 10 11 12 1314
WAVELENGTH (pm)
Figure 6-4. Atmospheric transmissivity. Some atmospheric constituents react
with certain wavelengths, absorbing some or all of the associated energy.