
Page 278 - Introduction to Autonomous Mobile Robots
P. 278
Planning and Navigation
start 263
goal
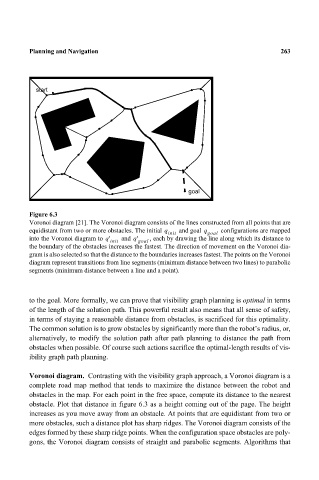
Figure 6.3
Voronoi diagram [21]. The Voronoi diagram consists of the lines constructed from all points that are
equidistant from two or more obstacles. The initial q and goal q configurations are mapped
init goal
into the Voronoi diagram to q' init and q' goal , each by drawing the line along which its distance to
the boundary of the obstacles increases the fastest. The direction of movement on the Voronoi dia-
gram is also selected so that the distance to the boundaries increases fastest. The points on the Voronoi
diagram represent transitions from line segments (minimum distance between two lines) to parabolic
segments (minimum distance between a line and a point).
to the goal. More formally, we can prove that visibility graph planning is optimal in terms
of the length of the solution path. This powerful result also means that all sense of safety,
in terms of staying a reasonable distance from obstacles, is sacrificed for this optimality.
The common solution is to grow obstacles by significantly more than the robot’s radius, or,
alternatively, to modify the solution path after path planning to distance the path from
obstacles when possible. Of course such actions sacrifice the optimal-length results of vis-
ibility graph path planning.
Voronoi diagram. Contrasting with the visibility graph approach, a Voronoi diagram is a
complete road map method that tends to maximize the distance between the robot and
obstacles in the map. For each point in the free space, compute its distance to the nearest
obstacle. Plot that distance in figure 6.3 as a height coming out of the page. The height
increases as you move away from an obstacle. At points that are equidistant from two or
more obstacles, such a distance plot has sharp ridges. The Voronoi diagram consists of the
edges formed by these sharp ridge points. When the configuration space obstacles are poly-
gons, the Voronoi diagram consists of straight and parabolic segments. Algorithms that