
Page 117 - Introduction to Colloid and Surface Chemistry
P. 117
Liquid-gas and liquid-liquid interfaces 107
affinity for the aqueous surface. Compression of the oleic acid film
forces the double bonds above the surface and eventually orientates
the hydrocarbon chains in a vertical position. This process is
somewhat gradual, as indicated by the form of the IT-A curve. In
conformity with this, the rate of oxidation of an oleic acid monolayer
by a dilute acid permanganate substrate is found to be greater at high
areas.
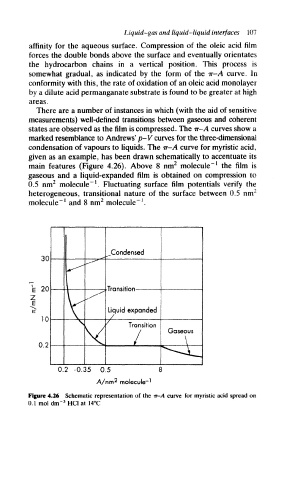
There are a number of instances in which (with the aid of sensitive
measurements) well-defined transitions between gaseous and coherent
states are observed as the film is compressed. The ir~A curves show a
marked resemblance to Andrews' p-V curves for the three-dimensional
condensation of vapours to liquids. The ir-A curve for myristic acid,
given as an example, has been drawn schematically to accentuate its
main features (Figure 4.26). Above 8 nm 2 molecule" 1 the film is
gaseous and a liquid-expanded film is obtained on compression to
!
0.5 nm 2 molecule" . Fluctuating surface film potentials verify the
heterogeneous, transitional nature of the surface between 0.5 nm 2
2
1
1
molecule" and 8 nm molecule" .
Condensed
qn ^*
•^
7
e 20 .^ Transition
z
E
K If) < Liquid expanded
s
v Transition Gaseous
0.2 , \
^^^-~
0.2 -0.35 0.5 8
2
/A/nm molecule" 1
Figure 4.26 Schematic representation of the ir-A curve for myristic acid spread on
3
0.1 mol dm' HC1 at 14°C