
Page 349 - Introduction to Electronic Commerce and Social Commerce
P. 349
336 11 Electronic Commerce Payment Systems and Order Fulfillment
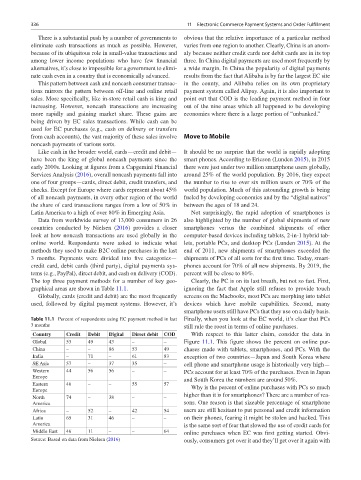
There is a substantial push by a number of governments to obvious that the relative importance of a particular method
eliminate cash transactions as much as possible. However, varies from one region to another. Clearly, China is an anom-
because of its ubiquitous role in small-value transactions and aly because neither credit cards nor debit cards are in its top
among lower income populations who have few financial three. In China digital payments are used most frequently by
alternatives, it’s close to impossible for a government to elimi- a wide margin. In China the popularity of digital payments
nate cash even in a country that is economically advanced. results from the fact that Alibaba is by far the largest EC site
This pattern between cash and noncash consumer transac- in the county, and Alibaba relies on its own proprietary
tions mirrors the pattern between off-line and online retail payment system called Alipay. Again, it is also important to
sales. More specifically, like in-store retail cash is king and point out that COD is the leading payment method in four
increasing. However, noncash transactions are increasing out of the nine areas which all happened to be developing
more rapidly and gaining market share. These gains are economies where there is a large portion of “unbanked.”
being driven by EC sales transactions. While cash can be
used for EC purchases (e.g., cash on delivery or transfers
from cash accounts), the vast majority of these sales involve Move to Mobile
noncash payments of various sorts.
Like cash in the broader world, cards—credit and debit— It should be no surprise that the world is rapidly adopting
have been the king of global noncash payments since the smart phones. According to Ericson (Lunden 2015), in 2015
early 2000s. Looking at figures from a Capgemini Financial there were just under two million smartphone users globally,
Services Analysis (2016), overall noncash payments fall into around 25% of the world population. By 2016, they expect
one of four groups—cards, direct debit, credit transfers, and the number to rise to over six million users or 70% of the
checks. Except for Europe where cards represent about 45% world population. Much of this astounding growth is being
of all noncash payments, in every other region of the world fueled by developing economies and by the “digital natives”
the share of card transactions ranges from a low of 50% in between the ages of 18 and 24.
Latin America to a high of over 80% in Emerging Asia. Not surprisingly, the rapid adoption of smartphones is
Data from worldwide survey of 13,000 consumers in 26 also highlighted by the number of global shipments of new
countries conducted by Nielsen (2016) provides a closer smartphones versus the combined shipments of other
look at how noncash transactions are used globally in the computer- based devices including tablets, 2-in-1 hybrid tab-
online world. Respondents were asked to indicate what lets, portable PCs, and desktop PCs (Lunden 2015). At the
methods they used to make B2C online purchases in the last end of 2011, new shipments of smartphones exceeded the
3 months. Payments were divided into five categories— shipments of PCs of all sorts for the first time. Today, smart-
credit card, debit cards (third party), digital payments sys- phones account for 70% of all new shipments. By 2019, the
tems (e.g., PayPal), direct debit, and cash on delivery (COD). percent will be close to 80%.
The top three payment methods for a number of key geo- Clearly, the PC is on its last breath, but not so fast. First,
graphical areas are shown in Table 11.1. ignoring the fact that Apple still refuses to provide touch
Globally, cards (credit and debit) are the most frequently screens on the Macbooks, most PCs are morphing into tablet
used, followed by digital payment systems. However, it’s devices which have mobile capabilities. Second, many
smartphone users still have PCs that they use on a daily basis.
Table 11.1 Percent of respondents using EC payment method in last Finally, when you look at the EC world, it’s clear that PCs
3 months still rule the roost in terms of online purchases.
Country Credit Debit Digital Direct debit COD With respect to this latter claim, consider the data in
Global 53 49 43 – – Figure 11.1. This figure shows the percent on online pur-
China – – 86 53 49 chases made with tablets, smartphones, and PCs. With the
India – 71 – 61 83 exception of two countries—Japan and South Korea where
SE Asia 57 – 37 35 – cell phone and smartphone usage is historically very high—
Western 44 56 56 – – PCs account for at least 70% of the purchases. Even in Japan
Europe and South Korea the numbers are around 50%.
Eastern 46 – – 55 57 Why is the percent of online purchases with PCs so much
Europe
North 74 – 38 – – higher than it is for smartphones? There are a number of rea-
America sons. One reason is that sizeable percentage of smartphone
Africa – 52 – 42 54 users are still hesitant to put personal and credit information
Latin 65 31 46 – – on their phones, fearing it might be stolen and hacked. This
America is the same sort of fear that slowed the use of credit cards for
Middle East 46 11 – – 64 online purchases when EC was first getting started. Obvi-
Source: Based on data from Nielsen (2016) ously, consumers got over it and they’ll get over it again with