
Page 176 - Introduction to Information Optics
P. 176
Exercises ! 61
(b) Carry out a detailed analysis to show that defects can be easily
detected through color coding.
2.43 The amplitude transmittance function of a multiplexed transparency, with
a positive and a negative image, is given by
t(x, y) = t v(x, y)(l + cosp 0x) + t 2(x, y)U + co$q 0y).
(a) Evaluate the smeared spectra at the Fourier plane.
(b) If the focal length of the transform lens is / = 300 mm, and the
sampling frequencies are p 0 = 807i and q 0 = 60?r rad/mm, compute
the smearing length of the Fourier spectra. Assume that the spectral
bandwidth of the white light source is limited by 350 to 750 nm.
(c) Design a set of transparent color filters by which the density (i.e., gray
levels of the image) can be encoded in pseudocolors at the output
plane.
(d) Compute the irradiance of the pseudocolor image.
2.44 To illustrate the noise immunity of the partially coherent system of Fig.
2.44, we assume that the narrow spectral band filters are contaminated
with additive white Gaussian noise; that is, H(a, ft] + n(a, /?). Show that the
output signal-to-noise ratio improves when the white light source is used.
2.45 Refer to the LCTV optical neural network (ONN) of Fig. 2.51.
(a) Calculate the space-bandwidth product (SBP) and the resolution
requirement for a 16 x 16-neuron network.
(b) Repeat part (a) for an N x JV-neuron net.
(c) Calculate the operation speed of the ONN.
(d) To improve the operation speed, show that one can either increase
the number of neurons or increase the frame rate of the SLM.
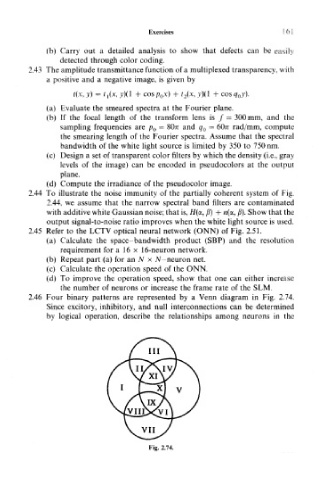
2.46 Four binary patterns are represented by a Venn diagram in Fig. 2.74.
Since excitory, inhibitory, and null interconnections can be determined
by logical operation, describe the relationships among neurons in the
Fig. 2.74.