Page 616 - Introduction to Information Optics
P. 616
10. Sensing with Optics

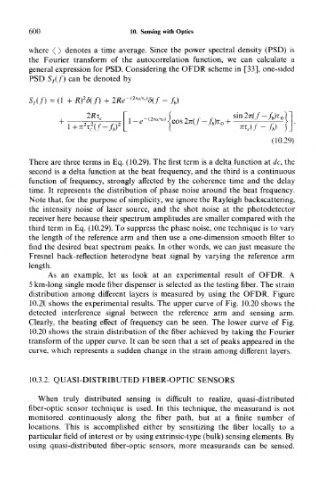
       where < > denotes a time average. Since the power spectral density (PSD) is
       the Fourier transform of the autocorrelation function, we can calculate a
       general expression for PSD. Considering the OFDR scheme in [33], one-sided
       PSD Si(f) can be denoted by


                                                                    (10.29)


       There are three terms in Eq. (10.29). The first term is a delta function aide, the
       second is a delta function at the beat frequency, and the third is a continuous
       function of frequency, strongly affected by the coherence time and the delay
       time. It represents the distribution of phase noise around the beat frequency.
       Note that, for the purpose of simplicity, we ignore the Rayleigh backscattering,
       the intensity noise of laser source, and the shot noise at the photodetector
       receiver here because their spectrum amplitudes are smaller compared with the
       third term in Eq. (10.29). To suppress the phase noise, one technique is to vary
       the length of the reference arm and then use a one-dimension smooth filter to
       find the desired beat spectrum peaks. In other words, we can just measure the
       Fresnel back-reflection heterodyne beat signal by varying the reference arm
       length.
            As an example, let us look at an experimental result of OFDR. A
       5 km-long single mode fiber dispenser is selected as the testing fiber. The strain
       distribution among different layers is measured by using the OFDR. Figure
       10.20 shows the experimental results. The upper curve of Fig. 10.20 shows the
       detected interference signal between the reference arm and sensing arm.
       Clearly, the beating effect of frequency can be seen. The lower curve of Fig.
       10.20 shows the strain distribution of the fiber achieved by taking the Fourier
       transform of the upper curve. It can be seen that a set of peaks appeared in the
       curve, which represents a sudden change in the strain among different layers.


       10.3.2. QUASI-DISTRIBUTED FIBER-OPTIC SENSORS

         When truly distributed sensing is difficult to realize, quasi-distributed
       fiber-optic sensor technique is used. In this technique, the measurand is not
       monitored continuously along the fiber path, but at a finite number of
       locations. This is accomplished either by sensitizing the fiber locally to a
       particular field of interest or by using extrinsic-type (bulk) sensing elements. By
       using quasi-distributed fiber-optic sensors, more measurands can be sensed.

