
Page 23 - Introduction to Mineral Exploration
P. 23
6 C.J. MOON & A.M. EVANS
1200 16
12
Ore production (Mt) Metal production (Mt) 8 Cu Zn
800
400
4 Pb
0
1900 1920 1940 1960 1980 2000 0
1900 1920 1940 1960 1980 2000
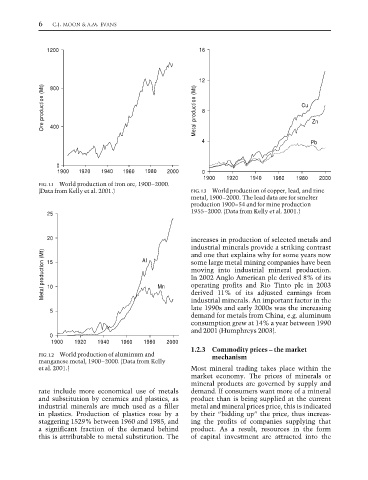
FIG. 1.1 World production of iron ore, 1900–2000.
(Data from Kelly et al. 2001.) FIG. 1.3 World production of copper, lead, and zinc
metal, 1900–2000. The lead data are for smelter
production 1900–54 and for mine production
1955–2000. (Data from Kelly et al. 2001.)
25
20 increases in production of selected metals and
industrial minerals provide a striking contrast
Metal production (Mt) 15 Mn some large metal mining companies have been
and one that explains why for some years now
Al
moving into industrial mineral production.
In 2002 Anglo American plc derived 8% of its
operating profits and Rio Tinto plc in 2003
10
derived 11% of its adjusted earnings from
industrial minerals. An important factor in the
late 1990s and early 2000s was the increasing
5
demand for metals from China, e.g. aluminum
consumption grew at 14% a year between 1990
and 2001 (Humphreys 2003).
0
1900 1920 1940 1960 1980 2000
1.2.3 Commodity prices – the market
FIG. 1.2 World production of aluminum and mechanism
manganese metal, 1900–2000. (Data from Kelly
et al. 2001.) Most mineral trading takes place within the
market economy. The prices of minerals or
mineral products are governed by supply and
rate include more economical use of metals demand. If consumers want more of a mineral
and substitution by ceramics and plastics, as product than is being supplied at the current
industrial minerals are much used as a filler metal and mineral prices price, this is indicated
in plastics. Production of plastics rose by a by their “bidding up” the price, thus increas-
staggering 1529% between 1960 and 1985, and ing the profits of companies supplying that
a significant fraction of the demand behind product. As a result, resources in the form
this is attributable to metal substitution. The of capital investment are attracted into the