
Page 26 - Introduction to Mineral Exploration
P. 26
1: ORE, MINERAL ECONOMICS, AND MINERAL EXPLORATION 9
ceramics. A useful article on developments in 6000
ceramic technology is by Wheat (1987).
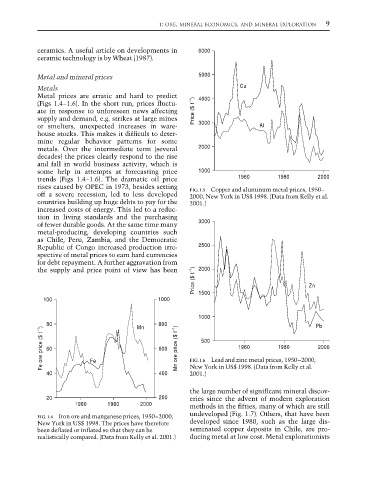
Metal and mineral prices 5000
Metals Cu
Metal prices are erratic and hard to predict 4000
(Figs 1.4–1.6). In the short run, prices fluctu-
ate in response to unforeseen news affecting Price ($ t –1 )
supply and demand, e.g. strikes at large mines
or smelters, unexpected increases in ware- 3000 Al
house stocks. This makes it difficult to deter-
mine regular behavior patterns for some
metals. Over the intermediate term (several 2000
decades) the prices clearly respond to the rise
and fall in world business activity, which is
some help in attempts at forecasting price 1000
trends (Figs 1.4–1.6). The dramatic oil price 1960 1980 2000
rises caused by OPEC in 1973, besides setting FIG. 1.5 Copper and aluminum metal prices, 1950–
off a severe recession, led to less developed 2000, New York in US$ 1998. (Data from Kelly et al.
countries building up huge debts to pay for the 2001.)
increased costs of energy. This led to a reduc-
tion in living standards and the purchasing
of fewer durable goods. At the same time many 3000
metal-producing, developing countries such
as Chile, Peru, Zambia, and the Democratic
Republic of Congo increased production irre- 2500
spective of metal prices to earn hard currencies
for debt repayment. A further aggravation from
Price ($ t –1 ) Zn
the supply and price point of view has been 2000
100 1000 1500
1000
80 Mn 800 Pb
Fe ore price ($ t –1 ) 60 Fe 600 Mn ore price ($ t –1 ) FIG. 1.6 Lead and zinc metal prices, 1950–2000, 2000
500
1960
1980
2001.)
40 400 New York in US$ 1998. (Data from Kelly et al.
the large number of significant mineral discov-
20 200 eries since the advent of modern exploration
1960 1980 2000 methods in the fifties, many of which are still
FIG. 1.4 Iron ore and manganese prices, 1950–2000, undeveloped (Fig. 1.7). Others, that have been
New York in US$ 1998. The prices have therefore developed since 1980, such as the large dis-
been deflated or inflated so that they can be seminated copper deposits in Chile, are pro-
realistically compared. (Data from Kelly et al. 2001.) ducing metal at low cost. Metal explorationists