
Page 27 - Introduction to Mineral Exploration
P. 27
10 C.J. MOON & A.M. EVANS 1200 3000
Number of discoveries 30 All deposits Production ($ oz −1 ) 1000 Real prices 2500 Production (tonnes)
Giant deposits
Output
25
(> $US 10 billion
800
2000
20
IGV)
1500
600
15
1000
400
10
500
200
0 5 0 1900 1920 1940 1960 1980 2000 0
1940 1950 1960 1970 1980 1990
FIG. 1.8 Gold price (in US$ in real 1999 terms) and
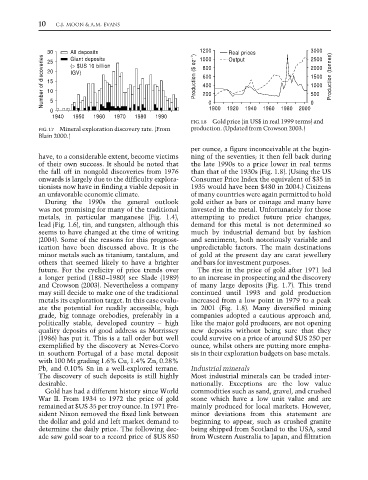
FIG. 1.7 Mineral exploration discovery rate. (From production. (Updated from Crowson 2003.)
Blain 2000.)
per ounce, a figure inconceivable at the begin-
have, to a considerable extent, become victims ning of the seventies; it then fell back during
of their own success. It should be noted that the late 1990s to a price lower in real terms
the fall off in nongold discoveries from 1976 than that of the 1930s (Fig. 1.8). (Using the US
onwards is largely due to the difficulty explora- Consumer Price Index the equivalent of $35 in
tionists now have in finding a viable deposit in 1935 would have been $480 in 2004.) Citizens
an unfavorable economic climate. of many countries were again permitted to hold
During the 1990s the general outlook gold either as bars or coinage and many have
was not promising for many of the traditional invested in the metal. Unfortunately for those
metals, in particular manganese (Fig. 1.4), attempting to predict future price changes,
lead (Fig. 1.6), tin, and tungsten, although this demand for this metal is not determined so
seems to have changed at the time of writing much by industrial demand but by fashion
(2004). Some of the reasons for this prognost- and sentiment, both notoriously variable and
ication have been discussed above. It is the unpredictable factors. The main destinations
minor metals such as titanium, tantalum, and of gold at the present day are carat jewellery
others that seemed likely to have a brighter and bars for investment purposes.
future. For the cyclicity of price trends over The rise in the price of gold after 1971 led
a longer period (1880–1980) see Slade (1989) to an increase in prospecting and the discovery
and Crowson (2003). Nevertheless a company of many large deposits (Fig. 1.7). This trend
may still decide to make one of the traditional continued until 1993 and gold production
metals its exploration target. In this case evalu- increased from a low point in 1979 to a peak
ate the potential for readily accessible, high in 2001 (Fig. 1.8). Many diversified mining
grade, big tonnage orebodies, preferably in a companies adopted a cautious approach and,
politically stable, developed country – high like the major gold producers, are not opening
quality deposits of good address as Morrissey new deposits without being sure that they
(1986) has put it. This is a tall order but well could survive on a price of around $US 250 per
exemplified by the discovery at Neves-Corvo ounce, whilst others are putting more empha-
in southern Portugal of a base metal deposit sis in their exploration budgets on base metals.
with 100 Mt grading 1.6% Cu, 1.4% Zn, 0.28%
Pb, and 0.10% Sn in a well-explored terrane. Industrial minerals
The discovery of such deposits is still highly Most industrial minerals can be traded inter-
desirable. nationally. Exceptions are the low value
Gold has had a different history since World commodities such as sand, gravel, and crushed
War II. From 1934 to 1972 the price of gold stone which have a low unit value and are
remained at $US 35 per troy ounce. In 1971 Pre- mainly produced for local markets. However,
sident Nixon removed the fixed link between minor deviations from this statement are
the dollar and gold and left market demand to beginning to appear, such as crushed granite
determine the daily price. The following dec- being shipped from Scotland to the USA, sand
ade saw gold soar to a record price of $US 850 from Western Australia to Japan, and filtration