
Page 33 - Introduction to Mineral Exploration
P. 33
16 C.J. MOON & A.M. EVANS
1990s have been of gold deposits but the rate reason for the difference in productivity, which
of discovery does not appear to have been suggests that improved exploration methods
sustained from more recent data (BHP Billiton in the future may lead to the discovery of many
2003). more small- and medium-sized deposits in
The study by Mackenzie and Woodall (1988) Australia.
of Australian and Canadian productivity is Mackenzie and Dogget (in Woodall 1992)
extremely penetrating and worthy of much have shown that the average cost of finding and
more discussion than there is space for here. It proving up economic metallic deposits in
should be emphasized that this analysis, and Australia over the period 1955–86 was about
others in the literature, is concerned almost $A51M or $A34M when discounted at the start
exclusively with metallic deposits, and com- of exploration. The average reward discounted
parable studies in the industrial mineral sector in the same manner is $A35M. This is little
still wait to be made. better than a breakeven situation. Dissecting
Mackenzie and Woodall studied base these data shows that the average exploration
metal exploration only and compared the expenditure per deposit is gold $A17M, nickel
period 1955–78 for Australia with 1946–77 for $A19M, and base metals $A219M. By contrast,
Canada. They drew some striking conclusions. the expected deposit value at the start of explo-
Australian exploration was found to have been ration for gold is $A24M and nickel $A42M.
uneconomic but Canadian financially very This provided the reasonable rates of return of
favorable. Although exploration expenditures 21% and 19% on the capital invested. On aver-
in Canada were double those in Australia the age $53M more has been invested in finding
resulting number of economic discoveries were and proving up an economic base metal deposit
eight times greater. Finding an economic de- than has been realized from its subsequent
posit in Australia cost four times as much and exploitation. Clearly gold and nickel have on
took four times longer to discover and assess as average been wealth creating whilst base metal
one in Canada. By contrast, the deposits found exploration has not.
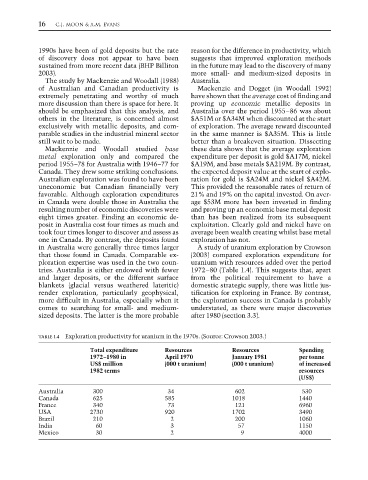
in Australia were generally three times larger A study of uranium exploration by Crowson
that those found in Canada. Comparable ex- (2003) compared exploration expenditure for
ploration expertise was used in the two coun- uranium with resources added over the period
tries. Australia is either endowed with fewer 1972–80 (Table 1.4). This suggests that, apart
and larger deposits, or the different surface from the political requirement to have a
blankets (glacial versus weathered lateritic) domestic strategic supply, there was little jus-
render exploration, particularly geophysical, tification for exploring in France. By contrast,
more difficult in Australia, especially when it the exploration success in Canada is probably
comes to searching for small- and medium- understated, as there were major discoveries
sized deposits. The latter is the more probable after 1980 (section 3.3).
TABLE 1.4 Exploration productivity for uranium in the 1970s. (Source: Crowson 2003.)
Total expenditure Resources Resources Spending
1972–1980 in April 1970 January 1981 per tonne
US$ million (000 t uranium) (000 t uranium) of increased
1982 terms resources
(US$)
Australia 300 34 602 530
Canada 625 585 1018 1440
France 340 73 121 6960
USA 2730 920 1702 3490
Brazil 210 2 200 1060
India 60 3 57 1150
Mexico 30 2 9 4000