
Page 34 - Introduction to Mineral Exploration
P. 34
1: ORE, MINERAL ECONOMICS, AND MINERAL EXPLORATION 17
6000 1600
Total PDAC
5000 Total MEG estimate 1400 Canada Old Series
Total MEG surveys
US$ million 3000 Expenditure (US$ million) 1200
4000
1000
2000
1000 800
600
0 400
1970 1975 1980 1985 1990 1995 2000 Australia Canada
200 New Series
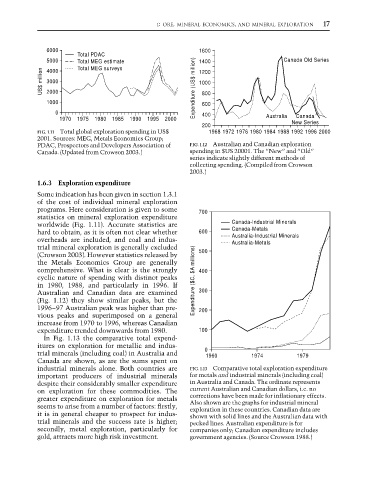
FIG. 1.11 Total global exploration spending in US$ 1968 1972 1976 1980 1984 1988 1992 1996 2000
2001. Sources: MEG, Metals Economics Group;
PDAC, Prospectors and Developers Association of FIG. 1.12 Australian and Canadian exploration
Canada. (Updated from Crowson 2003.) spending in $US 20001. The “New” and “Old”
series indicate slightly different methods of
collecting spending. (Compiled from Crowson
2003.)
1.6.3 Exploration expenditure
Some indication has been given in section 1.3.1
of the cost of individual mineral exploration
programs. Here consideration is given to some 700
statistics on mineral exploration expenditure
worldwide (Fig. 1.11). Accurate statistics are Canada-Industrial Minerals
hard to obtain, as it is often not clear whether 600 Canada-Metals
Australia-Industrial Minerals
overheads are included, and coal and indus- Australia-Metals
trial mineral exploration is generally excluded
(Crowson 2003). However statistics released by 500
the Metals Economics Group are generally
comprehensive. What is clear is the strongly 400
cyclic nature of spending with distinct peaks Expenditure ($C, $A millions)
in 1980, 1988, and particularly in 1996. If
Australian and Canadian data are examined 300
(Fig. 1.12) they show similar peaks, but the
1996–97 Australian peak was higher than pre- 200
vious peaks and superimposed on a general
increase from 1970 to 1996, whereas Canadian
expenditure trended downwards from 1980. 100
In Fig. 1.13 the comparative total expend-
itures on exploration for metallic and indus-
trial minerals (including coal) in Australia and 0 1960 1974 1979
Canada are shown, as are the sums spent on
industrial minerals alone. Both countries are FIG. 1.13 Comparative total exploration expenditure
important producers of industrial minerals for metals and industrial minerals (including coal)
despite their considerably smaller expenditure in Australia and Canada. The ordinate represents
on exploration for these commodities. The current Australian and Canadian dollars, i.e. no
greater expenditure on exploration for metals corrections have been made for inflationary effects.
seems to arise from a number of factors: firstly, Also shown are the graphs for industrial mineral
exploration in these countries. Canadian data are
it is in general cheaper to prospect for indus- shown with solid lines and the Australian data with
trial minerals and the success rate is higher; pecked lines. Australian expenditure is for
secondly, metal exploration, particularly for companies only; Canadian expenditure includes
gold, attracts more high risk investment. government agencies. (Source Crowson 1988.)