
Page 73 - Introduction to Mineral Exploration
P. 73
56 C.J. MOON & M.K.G. WHATELEY
TABLE 4.1 Corporate Exploration Spending in 2003 Net Exploration
(Source: Corporate websites and Mining Journal, income expenditures
March 2004.) 550 Inco 60
500
Income (I)
Company US$ million 400 50
De Beers 140 300 40
Rio Tinto 140 200 30
Barrick Gold 110 100
Newmont 86 Expenditure (E) 20
Companhia Vale do Rio Doce 81 0
BHP Billiton 68 –100 10
Anglogold 63
Anglo American (including 61 Constant 1982 US$ (millions) –200 0 US$ (millions)
platinum) 450 Noranda
Placer Dome 60 400 40
Phelps Dodge (including 50
research) 300
Noranda-Falconbridge 35 30
Teck-Cominco 30 200
Inco 27 100 20
Gold Fields 23
WMC Resources 20 0 10
Newcrest 19
Total spending ~2400 –100 0
1970 1975 1980
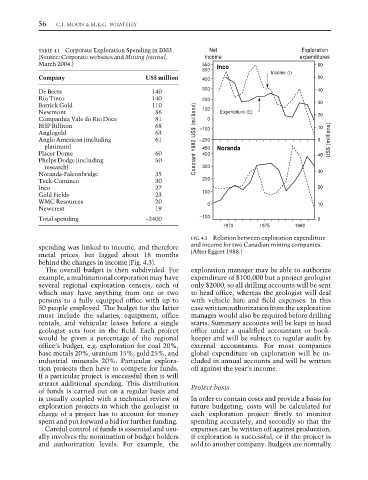
FIG. 4.3 Relation between exploration expenditure
spending was linked to income, and therefore and income for two Canadian mining companies.
metal prices, but lagged about 18 months (After Eggert 1988.)
behind the changes in income (Fig. 4.3).
The overall budget is then subdivided. For exploration manager may be able to authorize
example, a multinational corporation may have expenditure of $100,000 but a project geologist
several regional exploration centers, each of only $2000, so all drilling accounts will be sent
which may have anything from one or two to head office, whereas the geologist will deal
persons to a fully equipped office with up to with vehicle hire and field expenses. In this
50 people employed. The budget for the latter case written authorization from the exploration
must include the salaries, equipment, office manager would also be required before drilling
rentals, and vehicular leases before a single starts. Summary accounts will be kept in head
geologist sets foot in the field. Each project office under a qualified accountant or book-
would be given a percentage of the regional keeper and will be subject to regular audit by
office’s budget, e.g. exploration for coal 20%, external accountants. For most companies
base metals 20%, uranium 15%, gold 25%, and global expenditure on exploration will be in-
industrial minerals 20%. Particular explora- cluded in annual accounts and will be written
tion projects then have to compete for funds. off against the year’s income.
If a particular project is successful then it will
attract additional spending. This distribution
of funds is carried out on a regular basis and Project basis
is usually coupled with a technical review of In order to contain costs and provide a basis for
exploration projects in which the geologist in future budgeting, costs will be calculated for
charge of a project has to account for money each exploration project: firstly to monitor
spent and put forward a bid for further funding. spending accurately, and secondly so that the
Careful control of funds is essential and usu- expenses can be written off against production,
ally involves the nomination of budget holders if exploration is successful, or if the project is
and authorization levels. For example, the sold to another company. Budgets are normally