
Page 75 - Introduction to Mineral Exploration
P. 75
58 C.J. MOON & M.K.G. WHATELEY
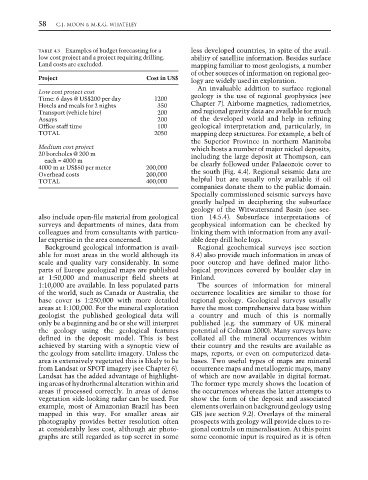
TABLE 4.3 Examples of budget forecasting for a less developed countries, in spite of the avail-
low cost project and a project requiring drilling. ability of satellite information. Besides surface
Land costs are excluded. mapping familiar to most geologists, a number
of other sources of information on regional geo-
Project Cost in US$ logy are widely used in exploration.
An invaluable addition to surface regional
Low cost project cost
Time: 6 days @ US$200 per day 1200 geology is the use of regional geophysics (see
Hotels and meals for 2 nights 350 Chapter 7). Airborne magnetics, radiometrics,
Transport (vehicle hire) 200 and regional gravity data are available for much
Assays 200 of the developed world and help in refining
Office staff time 100 geological interpretation and, particularly, in
TOTAL 2050 mapping deep structures. For example, a belt of
the Superior Province in northern Manitoba
Medium cost project which hosts a number of major nickel deposits,
20 boreholes @ 200 m including the large deposit at Thompson, can
each = 4000 m
4000 m at US$50 per meter 200,000 be clearly followed under Palaeozoic cover to
Overhead costs 200,000 the south (Fig. 4.4). Regional seismic data are
TOTAL 400,000 helpful but are usually only available if oil
companies donate them to the public domain.
Specially commissioned seismic surveys have
greatly helped in deciphering the subsurface
geology of the Witwatersrand Basin (see sec-
also include open-file material from geological tion 14.5.4). Subsurface interpretations of
surveys and departments of mines, data from geophysical information can be checked by
colleagues and from consultants with particu- linking them with information from any avail-
lar expertise in the area concerned. able deep drill hole logs.
Background geological information is avail- Regional geochemical surveys (see section
able for most areas in the world although its 8.4) also provide much information in areas of
scale and quality vary considerably. In some poor outcrop and have defined major litho-
parts of Europe geological maps are published logical provinces covered by boulder clay in
at 1:50,000 and manuscript field sheets at Finland.
1:10,000 are available. In less populated parts The sources of information for mineral
of the world, such as Canada or Australia, the occurrence localities are similar to those for
base cover is 1:250,000 with more detailed regional geology. Geological surveys usually
areas at 1:100,000. For the mineral exploration have the most comprehensive data base within
geologist the published geological data will a country and much of this is normally
only be a beginning and he or she will interpret published (e.g. the summary of UK mineral
the geology using the geological features potential of Colman 2000). Many surveys have
defined in the deposit model. This is best collated all the mineral occurrences within
achieved by starting with a synoptic view of their country and the results are available as
the geology from satellite imagery. Unless the maps, reports, or even on computerized data-
area is extensively vegetated this is likely to be bases. Two useful types of maps are mineral
from Landsat or SPOT imagery (see Chapter 6). occurrence maps and metallogenic maps, many
Landsat has the added advantage of highlight- of which are now available in digital format.
ing areas of hydrothermal alteration within arid The former type merely shows the location of
areas if processed correctly. In areas of dense the occurrences whereas the latter attempts to
vegetation side-looking radar can be used. For show the form of the deposit and associated
example, most of Amazonian Brazil has been elements overlain on background geology using
mapped in this way. For smaller areas air GIS (see section 9.2). Overlays of the mineral
photography provides better resolution often prospects with geology will provide clues to re-
at considerably less cost, although air photo- gional controls on mineralisation. At this point
graphs are still regarded as top secret in some some economic input is required as it is often