
Page 143 - Introduction to Naval Architecture
P. 143
STRENGTH 129
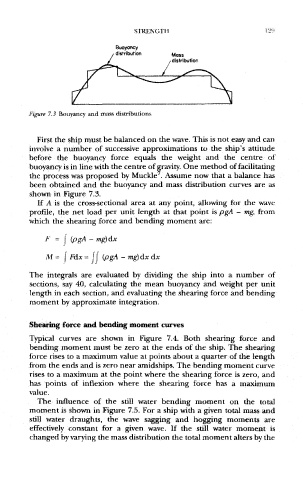
Figure 7,3 Bouyancy and mass distributions
First the ship must be balanced on the wave. This is not easy and can
involve a number of successive approximations to the ship's attitude
before the buoyancy force equals the weight and the centre of
buoyancy is in line with the centre of gravity. One method of facilitating
the process was proposed by Muckle . Assume now that a balance has
been obtained and the buoyancy and mass distribution curves are as
shown in Figure 7.3.
If A is the cross-sectional area at any point, allowing for the wave
profile, the net load per unit length at that point is pgA - mg, from
which the shearing force and bending moment are:
The integrals are evaluated by dividing the ship into a number of
sections, say 40, calculating die mean buoyancy and weight per unit
length in each section, and evaluating the shearing force and bending
moment by approximate integration.
Shearing force and bending moment curves
Typical curves are shown in Figure 7.4. Both shearing force and
bending moment must be zero at the ends of the ship. The shearing
force rises to a maximum value at points about a quarter of the length
from the ends and is zero near amidships. The bending moment curve
rises to a maximum at the point where die shearing force is zero, and
has points of inflexion where the shearing force has a maximum
value.
The influence of the still water bending moment on the total
moment is shown in Figure 7.5. For a ship with a given total mass and
still water draughts, the wave sagging and hogging moments are
effectively constant for a given wave. If the still water moment is
changed by varying the mass distribution the total moment alters by the