
Page 147 - Introduction to Naval Architecture
P. 147
STRENGTH 133
been zero, giving equal sagging and hogging bending moments of
718 MNm. '
The influence of small weight changes can be demonstrated by
influence lines.
Influence lines
The ship will not often be in the condition assumed in the standard
calculation. It is useful for an operator to be able to assess readily the
effects on longitudinal strength of additions or removals of weight
relative to the standard distribution. For small weight changes,
influence lines can be used to show the effect on the maximum
bending moment due to a unit weight added at any point along the
length. Lines are drawn for the hogging and sagging conditions. The
lines are found by taking a unit weight at some point along the length
and calculating the parallel sinkage and trim this causes to the ship
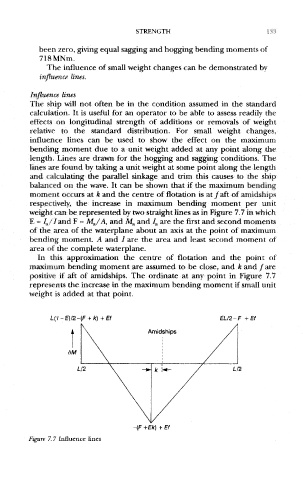
balanced on the wave. It can be shown that if the maximum bending
moment occurs at k and the centre of flotation is at/aft of amidships
respectively, the increase in maximum bending moment per unit
weight can be represented by two straight lines as in Figure 7.7 in which
E = / a //and F = M^/A, and M^ and I a are the first and second moments
of the area of the waterplane about an axis at the point of maximum
bending moment. A and / are the area and least second moment of
area of the complete waterplane.
In this approximation the centre of flotation and the point of
maximum bending moment are assumed to be close, and k and fare
positive if aft of amidships. The ordinate at any point in Figure 7.7
represents the increase in the maximum bending moment if small unit
weight is added at that point.
Figure 7.7 Influence lines