
Page 168 - Introduction to Naval Architecture
P. 168
154 STRENGTH
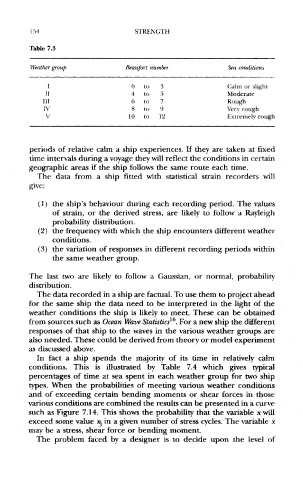
Table 7.3
Weat her group Beaujfort mumber &a conditions;
I 0 to 3 Calm or slight
11 4 to 5 Moderate
HI 6 to 7 Rough
IV 8 to 9 Very rough
v 10 to 12 Extremely rough
periods of relative calm a ship experiences. If they are taken at fixed
time intervals during a voyage they will reflect the conditions in certain
geographic areas if the ship follows the same route each time.
The data from a ship fitted with statistical strain recorders will
give:
(1) the ship's behaviour during each recording period. The values
of strain, or the derived stress, are likely to follow a Rayleigh
probability distribution.
(2) the frequency with which the ship encounters different weather
conditions.
(3) the variation of responses in different recording periods within
the same weather group.
The last two are likely to follow a Gaussian, or normal, probability
distribution.
The data recorded in a ship are factual. To use them to project ahead
for the same ship the data need to be interpreted in the light of the
weather conditions the ship is likely to meet. These can be obtained
16
from sources such as Ocean Wave Statistics . For a new ship the different
responses of that ship to the waves in the various weather groups are
also needed. These could be derived from theory or model experiment
as discussed above.
In fact a ship spends the majority of its time in relatively calm
conditions. This is illustrated by Table 7.4 which gives typical
percentages of time at sea spent in each weather group for two ship
types. When the probabilities of meeting various weather conditions
and of exceeding certain bending moments or shear forces in those
various conditions are combined the results can be presented in a curve
such as Figure 7.14. This shows the probability that the variable * will
exceed some value *j in a given number of stress cycles. The variable x
may be a stress, shear force or bending moment.
The problem faced by a designer is to decide upon the level of