
Page 165 - Introduction to Naval Architecture
P. 165
STRENGTH 151
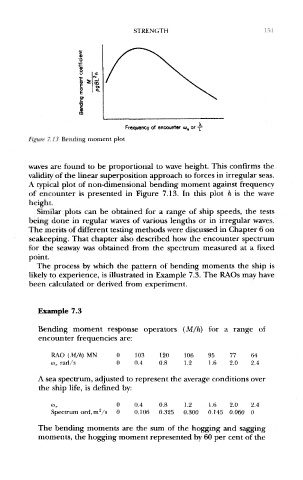
Frequency of encounter w t or -j-
Figure 7.13 Bending moment plot
waves are found to be proportional to wave height. This confirms the
validity of the linear superposition approach to forces in irregular seas,
A typical plot of non-dimensional bending moment against frequency
of encounter is presented in Figure 7.13. In this plot h is the wave
height.
Similar plots can be obtained for a range of ship speeds, the tests
being done in regular waves of various lengths or in irregular waves.
The merits of different testing methods were discussed in Chapter 6 on
seakeeping. That chapter also described how the encounter spectrum
for the seaway was obtained from the spectrum measured at a fixed
point
The process by which the pattern of bending moments the ship is
likely to experience, is illustrated in Example 7.3. The RAOs may have
been calculated or derived from experiment.
Example 7.3
Bending moment response operators (M/h) for a range of
encounter frequencies are:
RAO (M/h) MN 0 103 120 106 95 77 64
w e rad/s 0 0.4 0.8 1.2 1.6 2.0 2.4
A sea spectrum, adjusted to represent the average conditions over
the ship life, is defined by:
o> f 0 0.4 0.8 1.2 L6 2.0 2.4
Spectrum ord.mVs 0 0.106 0.325 0.300 0.145 0.060 0
The bending moments are the sum of the hogging and sagging
moments, the hogging moment represented by 60 per cent of the