
Page 116 - Introduction to Paleobiology and The Fossil Record
P. 116
PALEOECOLOGY AND PALEOCLIMATES 103
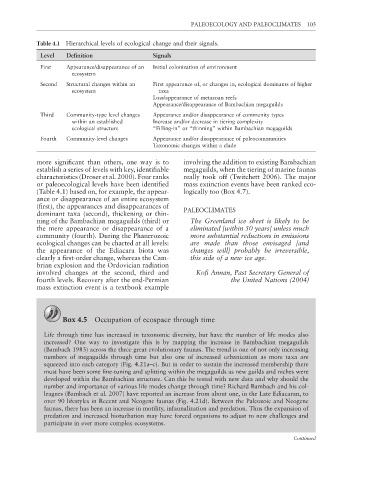
Table 4.1 Hierarchical levels of ecological change and their signals.
Level Defi nition Signals
First Appearance/disappearance of an Initial colonization of environment
ecosystem
Second Structural changes within an First appearance of, or changes in, ecological dominants of higher
ecosystem taxa
Loss/appearance of metazoan reefs
Appearance/disappearance of Bambachian megaguilds
Third Community-type level changes Appearance and/or disappearance of community types
within an established Increase and/or decrease in tiering complexity
ecological structure “Filling-in” or “thinning” within Bambachian megaguilds
Fourth Community-level changes Appearance and/or disappearance of paleocommunities
Taxonomic changes within a clade
more significant than others, one way is to involving the addition to existing Bambachian
establish a series of levels with key, identifi able megaguilds, when the tiering of marine faunas
characteristics (Droser et al. 2000). Four ranks really took off (Twitchett 2006). The major
or paleoecological levels have been identifi ed mass extinction events have been ranked eco-
(Table 4.1) based on, for example, the appear- logically too (Box 4.7).
ance or disappearance of an entire ecosystem
(fi rst), the appearances and disappearances of
dominant taxa (second), thickening or thin- PALEOCLIMATES
ning of the Bambachian megaguilds (third) or The Greenland ice sheet is likely to be
the mere appearance or disappearance of a eliminated [within 50 years] unless much
community (fourth). During the Phanerozoic more substantial reductions in emissions
ecological changes can be charted at all levels: are made than those envisaged [and
the appearance of the Ediacara biota was changes will] probably be irreversible,
clearly a first-order change, whereas the Cam- this side of a new ice age.
brian explosion and the Ordovician radiation
involved changes at the second, third and Kofi Annan, Past Secretary General of
fourth levels. Recovery after the end-Permian the United Nations (2004)
mass extinction event is a textbook example
Box 4.5 Occupation of ecospace through time
Life through time has increased in taxonomic diversity, but have the number of life modes also
increased? One way to investigate this is by mapping the increase in Bambachian megaguilds
(Bambach 1983) across the three great evolutionary faunas. The trend is one of not only increasing
numbers of megaguilds through time but also one of increased urbanization as more taxa are
squeezed into each category (Fig. 4.21a–c). But in order to sustain the increased membership there
must have been some fine-tuning and splitting within the megaguilds as new guilds and niches were
developed within the Bambachian structure. Can this be tested with new data and why should the
number and importance of various life modes change through time? Richard Bambach and his col-
leagues (Bambach et al. 2007) have reported an increase from about one, in the Late Ediacaran, to
over 90 lifestyles in Recent and Neogene faunas (Fig. 4.21d). Between the Paleozoic and Neogene
faunas, there has been an increase in motility, infaunalization and predation. Thus the expansion of
predation and increased bioturbation may have forced organisms to adjust to new challenges and
participate in ever more complex ecosystems.
Continued