
Page 152 - Introduction to Paleobiology and The Fossil Record
P. 152
FOSSIL FORM AND FUNCTION 139
Box 6.1 Phenetics and variation within populations
Frequently, paleontologists are faced with problems that require the simplification of a great mass
of measurements. For example, a paleontologist may have a large sample of fossils from a single
rock horizon and may wish to determine whether these represent one or more species. It might be
sufficient to plot univariate frequency histograms (see p. 16) of particular measures, such as width,
length and depth of the shells, as well as the hinge width, the diameter of the pedicle foramen, and
the length and width of internal muscle scars. In addition, bivariate plots could be prepared, in which
various measures are plotted against each other. However, it might still be diffi cult to differentiate
clusters of points, and this approach means the paleontologist has many separate graphs to
compare.
Multivariate techniques can help solve these problems by dealing with all the measured variates
together. Two common techniques are cluster analysis and principal components analysis (PCA). In
PCA, the maximum direction of variation is determined from the table of raw measurements of
many characters, and this direction is termed eigenvector 1. Further eigenvectors are then plotted in
sequence perpendicular to the first, representing successively less variation in the sample. The fi rst
eigenvector usually reflects growth-related or size-dependent variation, and it is typically ignored in
taxonomic studies. Species are usually plotted against the second and third eigenvectors, and tests
can then be applied to determine whether there are separate clusters of points.
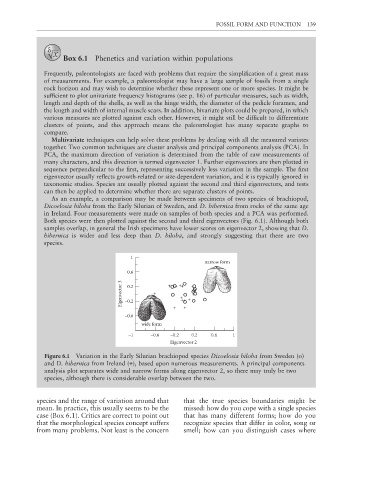
As an example, a comparison may be made between specimens of two species of brachiopod,
Dicoelosia biloba from the Early Silurian of Sweden, and D. hibernica from rocks of the same age
in Ireland. Four measurements were made on samples of both species and a PCA was performed.
Both species were then plotted against the second and third eigenvectors (Fig. 6.1). Although both
samples overlap, in general the Irish specimens have lower scores on eigenvector 2, showing that D.
hibernica is wider and less deep than D. biloba, and strongly suggesting that there are two
species.
1
narrow form
0.6
Eigenvector 3 –0.2 + + + + + + + +
0.2
+
+ +
–0.6 + +
wide form
–1 –0.6 –0.2 0.2 0.6 1
Eigenvector 2
Figure 6.1 Variation in the Early Silurian brachiopod species Dicoelosia biloba from Sweden (o)
and D. hibernica from Ireland (+), based upon numerous measurements. A principal components
analysis plot separates wide and narrow forms along eigenvector 2, so there may truly be two
species, although there is considerable overlap between the two.
species and the range of variation around that that the true species boundaries might be
mean. In practice, this usually seems to be the missed: how do you cope with a single species
case (Box 6.1). Critics are correct to point out that has many different forms; how do you
that the morphological species concept suffers recognize species that differ in color, song or
from many problems. Not least is the concern smell; how can you distinguish cases where